

7 Signals That Predict Post-Peak Chargeback Surges
Last Updated on October 13, 2026 by Dimitri Akhrin
Use transaction volume forecasting to spot dispute patterns weeks before they damage your margins
Learn the specific indicators eCommerce merchants should track after every major sales season to anticipate chargeback surges and have chargeback defense management systems come into play. This guide shifts dispute management from reactive to predictive using volume-driven pattern analysis.
TL;DR
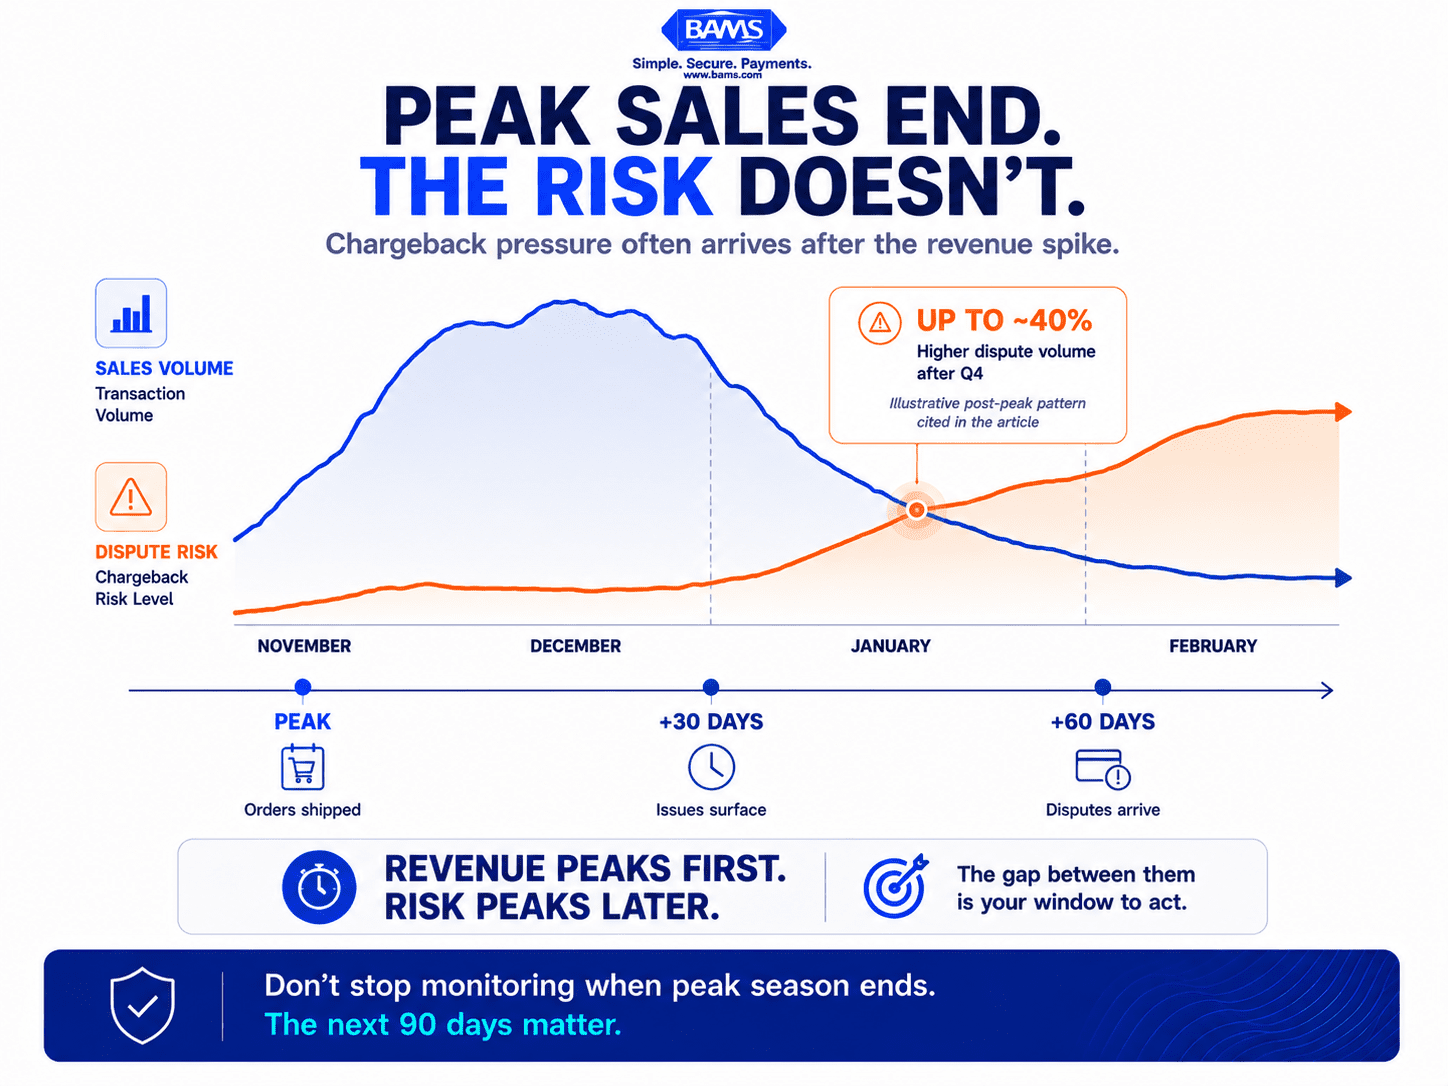
- Chargebacks from peak season arrive 30 to 60 days later – January and February dispute volumes can jump roughly 40% after Q4, hitting your ratios when your transaction count is low and your threshold is most vulnerable.
- Customer service tickets are your earliest warning – Support contacts about specific orders precede disputes by 7 to 14 days. Segment tickets by peak-period order cohorts and intervene before customers escalate to their bank.
- Weekly ratio tracking catches what monthly reporting hides – Card networks calculate ratios by dispute filing month, not transaction month. Two consecutive weeks of rising ratios post-peak should trigger immediate processor communication.
- Processor reserves and holds blindside growing brands – Verify your approved volume ceiling 60 to 90 days before peak. If your projected volume exceeds it, negotiate increases in advance to avoid surprise deposit delays.
- Start with three signals, not eight – Track support ticket velocity, weekly chargeback ratios, and processor reserve notifications for 90 days after every major sales season. Add more indicators as your team builds capacity.
The Post-Peak Chargeback Problem Nobody Budgets For
Your Q4 sales numbers looked strong. Revenue hit targets. Then January arrives, and so do the chargebacks. For eCommerce merchants processing seasonal volume, the real cost spike doesn’t happen during peak. It happens 30 to 60 days later, when disputes from holiday orders flood in, processor risk flags trigger reserve holds, and chargeback ratios climb toward monitoring thresholds.
Most merchants treat each dispute as an isolated incident. They fight chargebacks one at a time, reactively, without connecting them to the volume patterns that made them predictable earlier. That approach can become expensive. Visa notes that disputes can result from issues including fraud, processing errors, authorization problems, and customer dissatisfaction, which means patterns developing during a high-volume sales period can continue creating costs after the peak itself has ended.
Transaction volume forecasting changes this. When you track the right signals during and immediately after peak, you can see the dispute surge forming and act before it damages your margins.

The sale happens during peak. The dispute may not arrive for another 30 to 60 days, which is why post-peak monitoring matters.
Who This Is For and What It Covers
This guide is for eCommerce managers at established businesses (roughly 10 to 50 employees) who’ve survived at least one major sales season and felt the financial hangover that follows. If your processing volume doubles or triples during peak periods and your chargeback costs seem to arrive on a delay, this is built for you.
This is not a general fraud prevention checklist. It doesn’t cover checkout optimization or basic PCI compliance. Instead, it focuses on the specific leading indicators that predict post-peak chargeback surges, so you can reduce processing costs before they spike rather than after.
How These Indicators Were Selected
Each signal below meets three criteria: it becomes visible during or immediately after a volume spike, it precedes chargebacks by a measurable window (typically 7 to 60 days), and it’s trackable without enterprise-grade fraud detection algorithms. These are operational signals, not theoretical risk models. They’re drawn from dispute timing patterns, processor behavior triggers, and customer communication data that mid-size eCommerce teams can actually monitor.
8 Signals That Predict a Post-Peak Chargeback Surge
1. Customer Service Ticket Velocity on Specific Order Cohorts
Why it matters: Customers who can’t resolve issues through your support channels may escalate the problem through the dispute process instead. Mastercard emphasizes the importance of clear transaction records and supporting documentation when merchants respond to chargebacks. Tracking customer complaints before they become formal disputes gives you an opportunity to address legitimate order issues earlier and preserve the documentation you may need if a chargeback occurs.
What it looks like today: Most merchants track total ticket volume but don’t segment by order date cohort. The signal isn’t “more tickets overall.” It’s “more tickets about orders placed during Black Friday week, specifically about shipping delays or product mismatches.”
How to apply it: Tag support tickets by order date range during peak. Monitor ticket-to-order ratios for each peak cohort weekly. When that ratio exceeds your baseline by 20% or more, prioritize proactive outreach (refund offers, replacement shipments) to those customers before they file disputes.
2. Fulfillment Error Rate During the Volume Spike
Why it matters: High-volume periods can create more opportunities for fraud, fulfillment problems, and customer disputes when operational controls don’t scale with transaction volume. The Merchant Risk Council highlights the increasingly sophisticated nature of fraud and chargeback risk and the need for equally sophisticated prevention strategies. For seasonal merchants, that makes it important to monitor the operational problems created during a volume spike rather than waiting for the resulting disputes to appear later.
What it looks like today: Fulfillment dashboards show error rates in real time, but few merchants connect those rates to future dispute projections. A 3% fulfillment error rate during a 10,000-order week means 300 potential disputes arriving in February.
How to apply it: Calculate your historical conversion rate from fulfillment errors to chargebacks (typically 15% to 30% of unresolved errors become disputes). Multiply that by your peak-period error count. That number is your projected chargeback exposure. Use it to staff customer service and pre-authorize replacements.
3. Weekly Chargeback Ratio Movement (Not Monthly)
Why it matters: Monthly chargeback ratio reporting hides dangerous trends. A ratio that looks acceptable on December 31 can breach monitoring thresholds by January 15 if post-peak disputes cluster. Merchants should monitor chargeback ratios weekly instead of monthly during peak periods to catch emerging risk earlier.
What it looks like today: Card networks calculate chargeback ratios using the month the dispute is filed, not the month the original transaction occurred. This means your January ratio absorbs disputes from November and December orders, even though your January transaction volume may be much lower.
How to apply it: Build a simple spreadsheet tracking disputes received per week against transactions processed per week. When weekly ratios trend upward for two consecutive weeks post-peak, escalate immediately. Contact your processor to discuss the trend before it triggers automated monitoring. Tools like detailed payment analytics can surface ratio shifts that monthly statements obscure.
4. Billing Descriptor Confusion Complaints
Why it matters: “Friendly fraud” chargebacks (where the customer doesn’t recognize a legitimate charge) spike after peak seasons because customers forget purchases made during high-volume shopping periods. When your billing descriptor doesn’t clearly match your brand name, cardholders dispute charges they actually authorized.
What it looks like today: This shows up as “transaction not recognized” reason codes, which are distinct from actual fraud. The signal is an increase in this specific reason code 30 to 45 days after peak. Many merchants never check reason code distribution.
How to apply it: Pull reason code breakdowns from your processor after every peak season. If “not recognized” codes exceed 30% of total disputes, your descriptor needs updating. Also consider sending post-purchase confirmation emails that include the exact billing descriptor name so customers can match it to their statement.
5. Processor Reserve or Hold Notifications
Why it matters: When your transaction volume suddenly exceeds your approved processing ceiling, many processors respond by placing rolling reserves or deposit holds. Chargeback monitoring penalties and reserve holds may appear 30 to 60 days after peak, while deposit delays of 2 to 3 days during high-revenue periods can force borrowing costs.
What it looks like today: Growing eCommerce brands often don’t know their approved volume ceiling. They process $200K in November after averaging $80K monthly, and their processor flags the account. The hold notification arrives by email or (worse) shows up as a delayed deposit with no explanation.
How to apply it:Request a qualification report and verify your approved volume ceilings 60 to 90 days before expected peak. If your projected volume exceeds your ceiling, negotiate an increase in advance. Merchants working with BAMS can use dedicated account management and next-day funding to avoid the cash flow gap that surprise holds create during high-volume periods.
6. Return Rate Acceleration by Product Category
Why it matters: Returns that happen within your policy window don’t become chargebacks. Returns that fall outside your window (or that customers find too difficult to process) do. Post-peak return rates that exceed your baseline by category signal which product lines will generate disputes 30 to 60 days later.
What it looks like today: Most merchants track aggregate return rates. The predictive signal is category-level return velocity. If electronics returns spike 40% above baseline while apparel returns stay flat, your chargeback exposure is concentrated in electronics orders.
How to apply it: Segment returns by product category and compare to historical baselines for the same post-peak window. For categories exceeding baseline by 25% or more, extend return windows proactively and simplify the return process. Every return you process internally is a chargeback you avoid.
7. Authorization Decline Rate Changes
Why it matters: A rising authorization decline rate during peak often indicates your fraud detection algorithms are tightening (or your processor’s risk engine is). While this prevents some fraudulent transactions, overly aggressive declines push legitimate customers toward chargebacks on orders that did go through, because the same risk signals that triggered declines on some orders also correlate with dispute-prone transactions that were approved.
What it looks like today: Merchants see their decline rate jump from 5% to 12% during peak and assume the system is working. But the approved transactions that share characteristics with declined ones (new customers, high-value orders, mismatched shipping addresses) are your highest chargeback risk pool.
How to apply it: After peak, pull a report of approved transactions that scored just below your decline threshold. These “near-miss” approvals are your most dispute-prone cohort. Monitor them for delivery confirmation and customer service contacts. Consider proactive outreach (order confirmation calls or emails) for orders above a dollar threshold. Reviewing your payment authorization rates systematically can reveal where your fraud rules are creating downstream costs.
8. Interchange Downgrade Patterns Post-Peak
Why it matters: Seasonal volume spikes often cause operational shortcuts (missing shipping data, incomplete transaction records, skipped address verification) that result in interchange downgrades. These downgrades raise your per-transaction cost silently, and they compound the financial damage when chargebacks also increase.
What it looks like today: Your effective processing rate climbs 0.3% to 0.5% after peak, but your pricing model hasn’t changed. The culprit is usually missing Level 2 and Level 3 data on transactions processed during the rush. Downgrades don’t appear as a line item labeled “downgrade.” They show up as higher interchange categories on your statement.
How to apply it: Compare your interchange qualification rates from peak months to your baseline months. If the percentage of transactions qualifying at the lowest interchange tier dropped during peak, identify which data fields were missing. Fix those gaps in your gateway configuration before the next season. This is a cost reduction initiative that pays off every cycle.
The Pattern Behind These Signals
These eight indicators share a common structure: they are all operational byproducts of volume spikes that become financial liabilities on a delay. The delay (typically 30 to 60 days) is what makes them dangerous. By the time the chargeback appears on your statement, the window for prevention has closed.
The merchants who manage seasonal volume optimization effectively aren’t running more sophisticated fraud models. They’re treating the post-peak period as a distinct operational phase with its own metrics. They shift from revenue-focused dashboards to risk-focused dashboards the moment peak volume subsides.
Notice that several signals reinforce each other. Fulfillment errors drive support tickets. Support tickets that go unresolved drive chargebacks. Chargebacks push ratios toward monitoring thresholds. Monitoring triggers reserves. Reserves restrict cash flow. Each link in this chain is breakable, but only if you see it forming.
Where to Start Without Overwhelming Your Team
You do not need to monitor every possible risk signal on day one. Start with the three that show customer friction, rising dispute pressure, and immediate cash-flow exposure.
You don’t need to track all eight signals simultaneously. Start with three: customer service ticket velocity by order cohort (#1), weekly chargeback ratio movement (#3), and processor reserve notifications (#5). These three cover the earliest warning (tickets), the most dangerous threshold (ratio monitoring), and the most immediate cash flow threat (reserves).
Build tracking for these three into your post-peak standard operating procedure. Run them weekly for 90 days after every major sales season. Add the remaining signals as your team develops capacity. The goal isn’t perfect prediction. It’s shifting from reactive dispute management to a forecasting posture that lets you intervene while intervention still matters.
Frequently Asked Questions
What is a seasonal volume playbook in merchant services optimization?
A seasonal volume playbook is a documented set of pre-peak, during-peak, and post-peak procedures that cover processor communication, volume ceiling verification, chargeback ratio monitoring, and cash flow planning. It treats each sales season as a project with defined preparation timelines (typically starting 60 to 90 days before expected volume increases) and post-peak monitoring windows (90 days after peak subsides).
How can businesses use data to forecast transaction volume for seasonal planning?
Start with your historical transaction data from previous peak periods. Calculate your average daily transaction count and dollar volume for each month, then overlay year-over-year growth rates. Factor in planned promotions, marketing spend increases, and product launches. The goal is to project your peak daily volume accurately enough to verify it falls within your processor’s approved ceiling and to staff fulfillment and customer service accordingly.
When should businesses review their payment processing setup before peak seasons?
Begin your payment system review 60 to 90 days before expected volume spikes. This gives you time to request qualification reports, negotiate volume ceiling increases, update billing descriptors, verify that your gateway is passing Level 2 and Level 3 data correctly, and test your fraud rule thresholds against projected order patterns.
Why do chargebacks spike after peak season instead of during it?
Chargebacks operate on a delay. Customers receive orders days or weeks after purchase, then may wait additional time before contacting their bank. Card networks also have processing timelines that add days to the dispute cycle. The result is that orders placed in November and December generate disputes that arrive in January and February, often 30 to 60 days after the original transaction.
How can payment processors optimize their services for seasonal fluctuations in volume?
Processors that serve seasonal businesses well offer proactive account management (contacting merchants before peak to adjust volume ceilings), next-day funding to prevent cash flow gaps during high-revenue periods, and transparent communication about reserve policies. Merchants should evaluate their processor’s seasonal readiness as part of their pre-peak playbook rather than waiting for problems to surface.
Which strategies help manage peak retail season chargeback risk effectively?
The most effective strategies are preventive rather than reactive. These include extending return windows to keep disputes in-house, ensuring billing descriptors match your brand name, forecasting fulfillment capacity against projected order volume, and monitoring chargeback ratios weekly (not monthly) during and after peak. Proactive customer outreach to orders flagged as high-risk also reduces dispute rates significantly.
Sources
- https://corporate.visa.com/en/solutions/acceptance/chargebacks.html
- https://www.mastercard.com/us/en/news-and-trends/Insights/2024/how-can-merchants-dispute-credit-card-chargebacks.html
- https://merchantriskcouncil.org/learning/resource-center/member-news/blog/2025/chargebacks-and-fraud-2025-fighting-advanced-fraud-tactics-with-equally-sophisticated-strategies


