7 Signals Your Credit Card Processing Fees Are Too High
Last Updated on October 7, 2026 by Dimitri Akhrin
Per-transaction cost diagnostics that reveal whether your contactless payment processor is leaving money on the table
Learn the specific benchmarking signals most eCommerce managers miss when auditing credit card processing fees. This diagnostic framework covers interchange tier qualification, chargeback cost compounding, and cash flow timing across contactless and mobile wallet transactions.
TL;DR
- Calculate your effective rate, not your quoted rate – Divide total fees by total volume. If the gap exceeds 0.3% from what you were quoted, hidden markups are likely inflating your costs.
- Verify contactless transactions qualify at card-present interchange tiers – Misconfigured gateways can route tap-to-pay and mobile wallet transactions through higher-cost card-not-present rails, adding 0.10% to 0.30% per transaction.
- Measure chargeback cost as a percentage of revenue, not just a count – Each chargeback carries fees, lost goods, and long-term rate increases that compound well beyond the disputed amount.
- Capture Level 2/Level 3 data for B2B transactions – Submitting enhanced transaction data (tax, line items, customer codes) on corporate and purchasing cards can reduce interchange by 0.5% to 1.0% per transaction.
- Factor funding speed into your true processing cost – Every day your processor holds funds costs you float. Next-day funding eliminates this hidden expense and improves cash flow predictability.
The Benchmarking Gap Most eCommerce Managers Don’t Know They Have
Your credit card processing fees probably cost you between 1.5% and 3.5% per transaction. You know this. What you likely don’t know is whether your contactless payment transactions are qualifying at the lowest possible interchange tier, or whether your payment processor is quietly pocketing the difference.
U.S. credit card companies collected a record $148.5 billion in merchant processing fees in 2024, up from $136 billion the year before. That growth isn’t coming from new merchants entering the market. It’s coming from existing merchants absorbing incremental cost increases they never audited.
Most eCommerce managers treat processing costs as a fixed line item. They compare processors on headline rates, sign a contract, and move on. But the real savings live in the diagnostic layer underneath: how each transaction qualifies, how chargebacks compound hidden costs, and how cash flow timing interacts with your effective rate.
Who This Is For (and What It Won’t Cover)
This list is for eCommerce managers at established online businesses who already accept contactless and mobile wallet payments. You have volume. You have transaction data. What you may not have is a framework for diagnosing whether your per-transaction costs are optimized or inflated.
This is not a guide to setting up Apple Pay or choosing your first payment gateway. It won’t cover consumer-facing wallet features. Instead, it surfaces seven specific diagnostic signals that reveal whether your processor is leaving money on the table, and what to do about each one.
How We Selected These Signals
Each signal was chosen based on three criteria: it must be measurable from data you already have (or should have), it must directly affect your effective processing rate, and it must be a lever you can actually pull without switching your entire payment stack. We prioritized signals that compound, meaning fixing one often improves another.
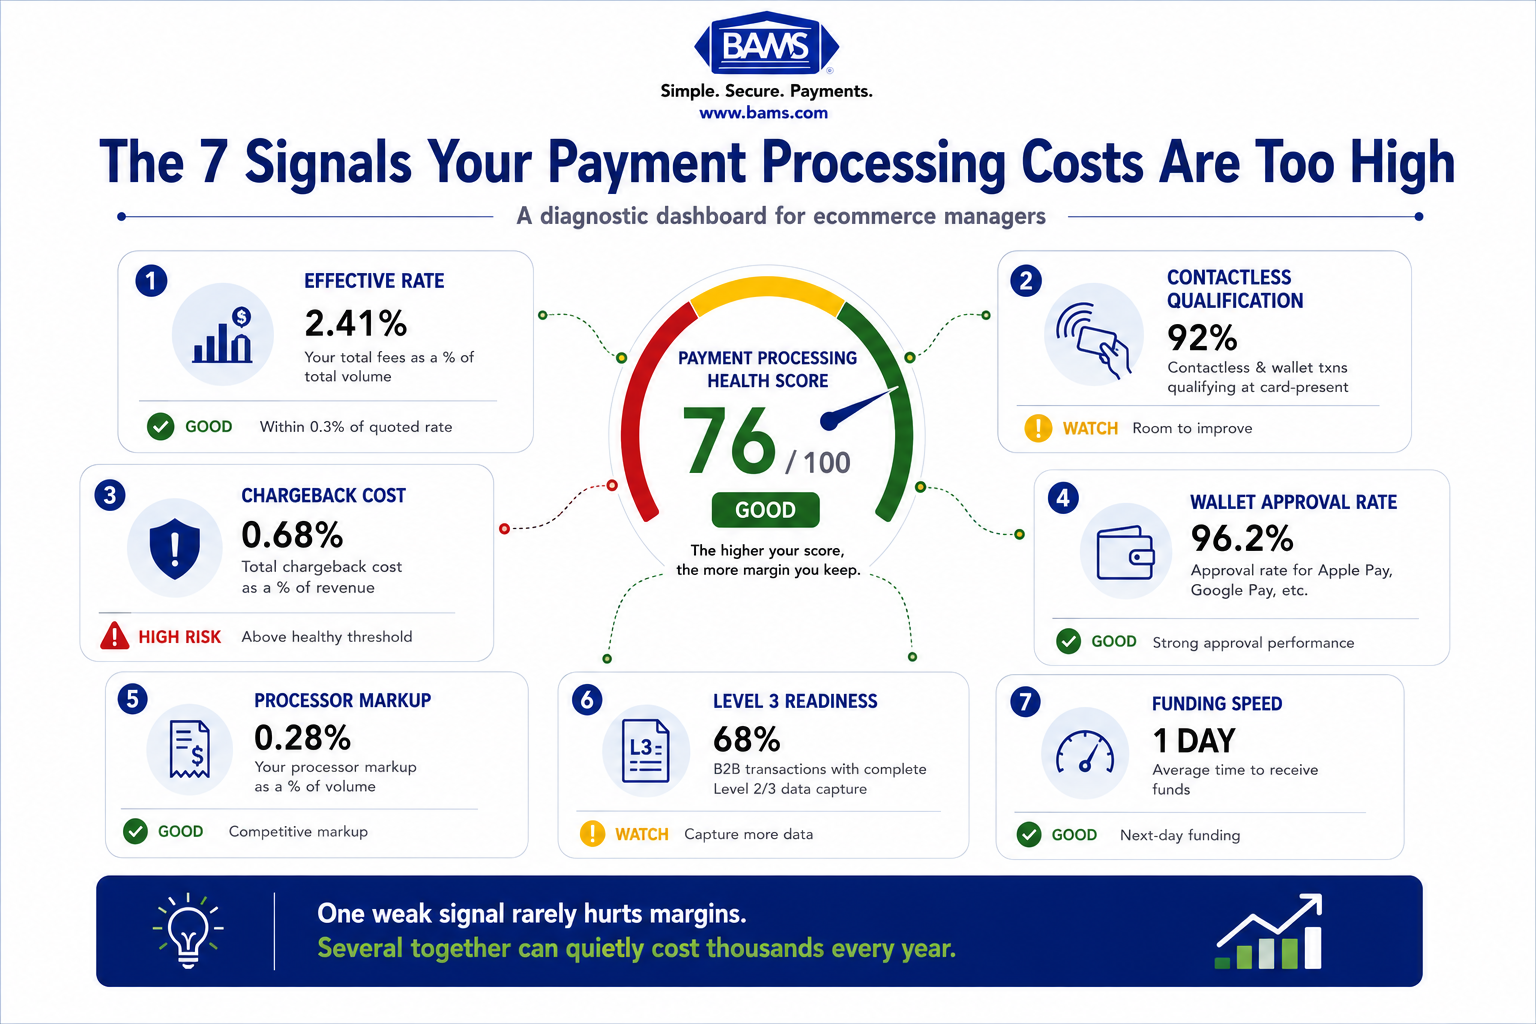
Most merchants only monitor processing fees. The real savings come from tracking seven operational signals that quietly determine your effective processing rate and overall profitability.
7 Signals Your Contactless Payment Costs Are Higher Than They Should Be
1. Your Effective Rate Differs From Your Quoted Rate by More Than 0.3%
Why it matters: The rate your processor quoted you is not the rate you’re paying. Your effective rate (total fees divided by total volume) includes interchange, assessments, and processor markup. An estimated 70% of businesses overpay due to hidden markups buried in blended or tiered pricing models. A gap larger than 0.3% between your quoted and effective rates signals margin leakage.
What it looks like today: Blended pricing bundles all card types and transaction methods into a single rate, which means your Apple Pay Visa debit transaction and your manually keyed Amex corporate card are billed identically, even though interchange costs differ by over 1%. Interchange-plus pricing exposes these differences. If your statements don’t show interchange line items, you’re flying blind.
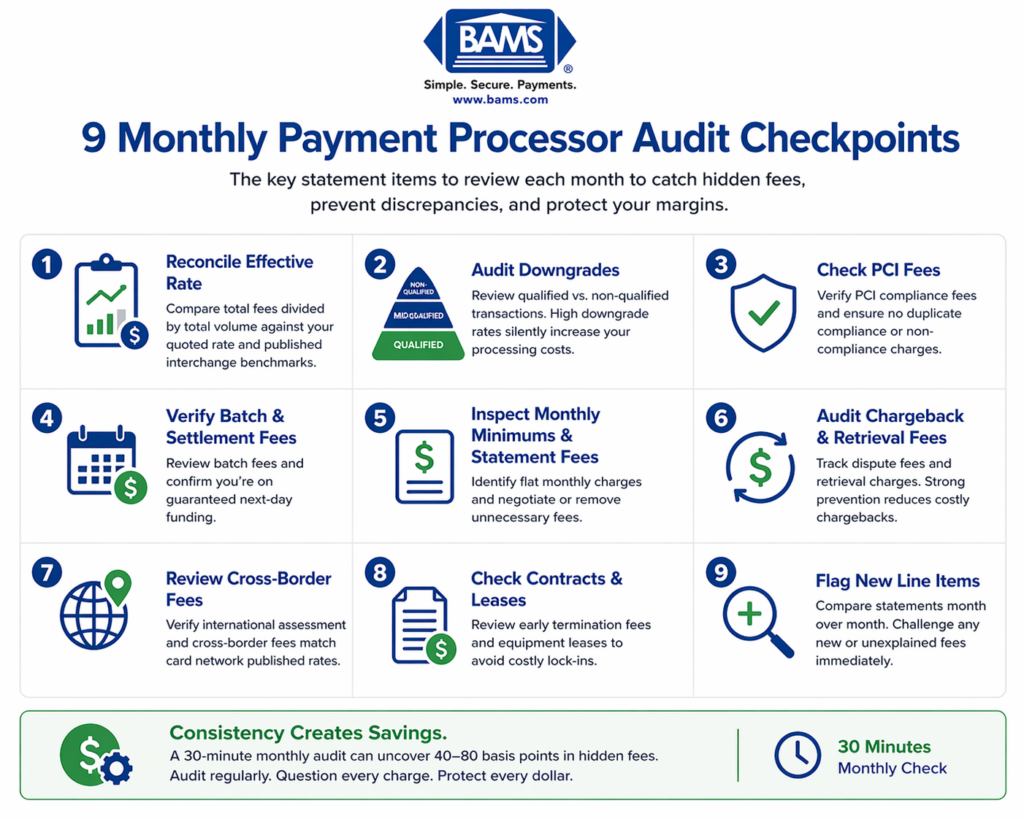
How to apply it: Pull your last three monthly statements. Divide total fees by total processing volume. Compare that effective rate to your quoted rate. If the gap exceeds 0.3%, request an interchange-plus breakdown from your processor. For a detailed walkthrough on reading your statements, this guide to credit card processing fees covers the three-part fee structure and how to audit each component.
2. Your Contactless Transactions Aren’t Qualifying at Card-Present Interchange Tiers
Why it matters: Contactless and mobile wallet transactions (Apple Pay, Google Pay) should qualify at card-present interchange rates, which are lower than card-not-present rates. Contactless and mobile wallet transactions are processed differently from traditional eCommerce transactions because they use EMV technology and tokenization. Proper gateway and terminal configuration helps ensure these transactions qualify for the appropriate interchange category. PCI Security Standards Council guidance explains how EMV and tokenization improve payment security for modern contactless transactions.
What it looks like today: Some gateway configurations route NFC transactions through card-not-present rails, especially when the terminal setup doesn’t properly pass EMV cryptogram data. The result: your customer tapped their phone, but your processor treated it like a manual key entry.
How to apply it: Ask your processor for a transaction-level interchange qualification report. Filter for contactless and mobile wallet transactions specifically. If more than 5% are downgrading to a higher interchange category, the issue is likely in your terminal or gateway configuration, not the card network.
3. You Don’t Know Your Chargeback-to-Revenue Ratio
Why it matters: Chargebacks don’t just cost you the disputed amount. Each one carries fees ($20 to $100 per incident), increases your risk profile with acquirers, and can push your processing rates higher at renewal. When your chargeback ratio exceeds 1%, some processors impose penalty rates or monitoring programs that compound costs for months.
What it looks like today: Most eCommerce managers track chargeback count but not chargeback cost as a percentage of revenue. The total cost includes the lost sale, the chargeback fee, the cost of goods, shipping, and the increased interchange rates that follow. For businesses processing $500K annually, even a 0.5% chargeback rate can mean $10K or more in combined losses.
How to apply it: Calculate your all-in chargeback cost: (disputed amount + chargeback fee + cost of goods + shipping) × number of chargebacks per month. Divide by monthly revenue. If this number surprises you, it’s time to invest in proactive chargeback defense. Chargeback protection tools like instant alerts and rapid-response interfaces can reduce dispute escalation before it hits your ratio.
4. Your Mobile Wallet Approval Rates Are Lower Than Traditional Card Rates
Why it matters: Mobile wallet transactions (Apple Pay, Google Pay) use device-specific tokens instead of raw card numbers. This tokenization should improve approval rates because it reduces fraud flags. If your mobile wallet approval rate is lower than your traditional card approval rate, something in your authorization chain is misconfigured.
What it looks like today: Declined mobile wallet transactions often stem from mismatched merchant category codes, incorrect token routing, or acquirer-side rules that flag tokenized transactions as higher risk. Each declined transaction is lost revenue and a frustrated customer who may not retry.
How to apply it: Segment your authorization data by payment method. Compare approval rates for Apple Pay and Google Pay against standard chip and contactless card transactions. If mobile wallets underperform by more than 2 percentage points, escalate to your processor’s technical team with specific transaction IDs for investigation.
5. You Haven’t Audited Your Processor’s Markup in Over 12 Months
Why it matters: Interchange rates change twice a year (April and October for Visa and Mastercard). Your processor’s markup, however, may have changed without notice, especially if your contract includes rate adjustment clauses. U.S. banks collected nearly $66 billion in interchange fees in 2025, up from $64 billion the prior year. Costs are rising at the network level. The question is whether your processor is passing those through cleanly or adding margin on top.
What it looks like today: Many processors add basis points incrementally, sometimes labeled as “technology fees,” “PCI compliance surcharges,” or “network access fees.” These line items can add 0.05% to 0.15% each, and they accumulate. Merchants who signed contracts 18 months ago may be paying 0.3% more than they realize. If your processor’s billing practices feel opaque, this breakdown of hidden fee structures illustrates how quickly small surcharges compound.
How to apply it: Request your current fee schedule in writing. Compare it to your original contract. Flag any line items that weren’t in the original agreement. If your processor can’t explain a fee in one sentence, it’s worth negotiating or removing.
6. You’re Not Capturing Level 2/Level 3 Transaction Data
Why it matters: For B2B eCommerce or transactions involving corporate, purchasing, or government cards, submitting enhanced data (tax amount, customer code, line-item detail) can qualify you for significantly lower interchange rates. The difference between Level 1 and Level 3 qualification can be 0.5% to 1.0% per transaction. If you sell to businesses or institutions, this is likely your largest single savings opportunity.
What it looks like today: Most eCommerce platforms don’t capture Level 2/3 data by default. It requires gateway-level configuration and sometimes custom field mapping. Processors rarely volunteer this optimization because it reduces their interchange pass-through revenue.
How to apply it: Review your customer mix. If more than 15% of your transactions come from corporate or purchasing cards, ask your processor whether your gateway supports Level 2/3 data submission. If it doesn’t, this alone may justify evaluating a new processor. BAMS, for example, offers interchange-plus pricing with dedicated account management that can identify these qualification gaps during onboarding, helping merchants capture savings they didn’t know existed.
7. Your Funding Timeline Is Inflating Your Real Cost of Processing
Why it matters: Processing fees are the visible cost. The invisible cost is the time value of your money between transaction and deposit. If your processor holds funds for 48 to 72 hours (standard for many providers), you’re effectively extending an interest-free loan on every sale. For businesses with tight cash cycles, this delay forces reliance on credit lines, which carry their own costs.
What it looks like today: Next-day funding used to be a premium feature. It’s increasingly standard among processors that serve ecommerce merchants with consistent volume. The difference between 24-hour and 72-hour funding on $30K in daily sales is roughly $60K in float over a month. That float has a cost, whether it shows up in interest payments, missed vendor discounts, or delayed inventory purchases.
How to apply it: Calculate your average daily processing volume. Multiply by the number of days your processor holds funds. That’s your float exposure. If your processor doesn’t offer next-day funding, or charges a premium for it, factor that cost into your effective rate comparison. BAMS provides next-day funding as a standard feature, which eliminates the hidden float cost that inflates your true processing expense.
What These Signals Have in Common
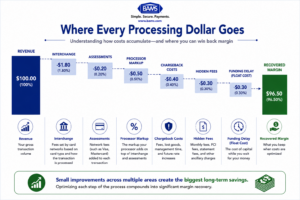
Processing costs aren’t driven by one fee. They accumulate across multiple layers, making small inefficiencies add up to significant margin loss over time.
Every signal on this list points to the same structural problem: eCommerce managers are optimizing for the wrong variable. They negotiate headline rates and ignore effective rates. They count chargebacks but don’t calculate chargeback cost as a percentage of revenue. They accept funding timelines without pricing the float.
The businesses that actually reduce processing costs treat fees as a system, not a line item. Interchange qualification, chargeback ratios, approval rates, data capture, and funding speed all interact. Fixing your interchange qualification reduces your effective rate. Reducing chargebacks keeps your risk profile low, which protects your rate at renewal. Faster funding improves cash flow, which reduces your dependence on credit.
The compounding effect is real. Merchants who address three or four of these signals simultaneously often see effective rate reductions of 0.4% to 0.8%, which on $1M in annual volume translates to $4,000 to $8,000 in recovered margin.
Where to Start Without Overwhelming Your Team
You don’t need to tackle all seven signals at once. Start with Signal 1 (effective rate calculation) because it gives you a baseline. If the gap between your quoted and effective rate is small, your processor may be doing a reasonable job. If it’s large, Signals 5 and 6 (markup audit and Level 2/3 data) are your highest-leverage next steps.
For teams with limited bandwidth, focus on the signals that require data you already have. Your monthly statements contain Signals 1, 3, and 5. Your gateway dashboard contains Signals 2 and 4. Signals 6 and 7 require conversations with your processor, but those conversations take 30 minutes, not 30 days.
The goal isn’t perfection. It’s visibility. Once you can see where your costs actually live, the savings decisions become straightforward.
Frequently Asked Questions
What fees do merchants actually pay when accepting Apple Pay?
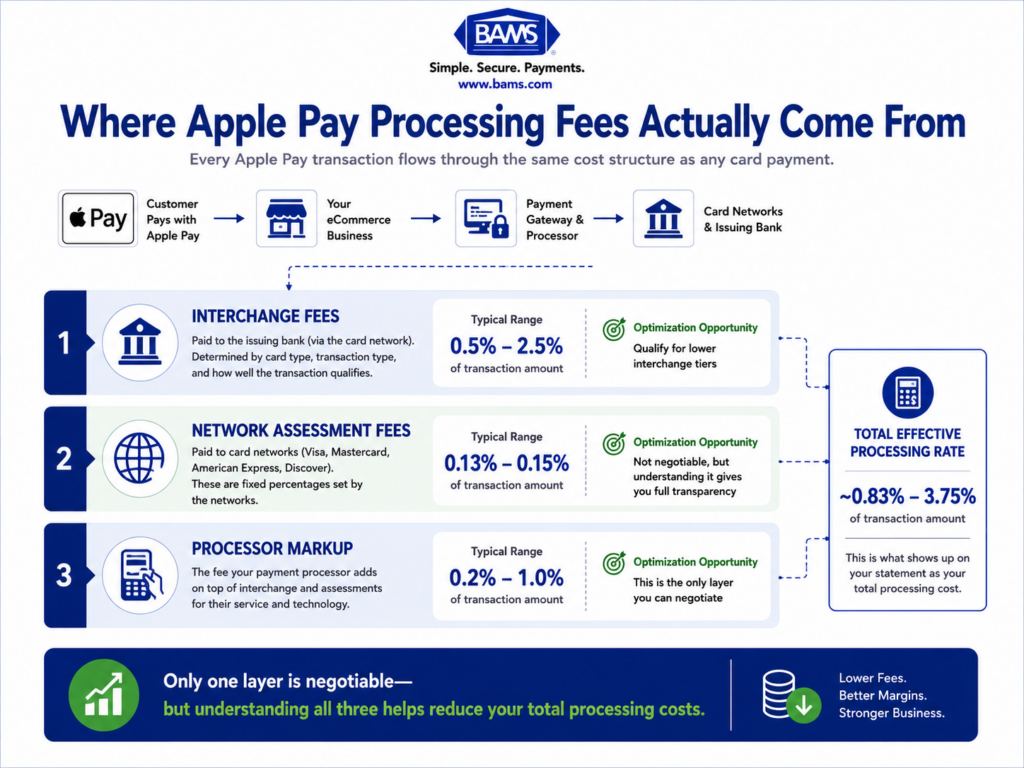
Apple doesn’t charge merchants a fee for accepting Apple Pay. The costs come from standard credit card processing fees: interchange (paid to the card-issuing bank), network assessments (paid to Visa, Mastercard, etc.), and your processor’s markup. Because Apple Pay uses tokenization and qualifies as a card-present transaction in-store, it should route through lower interchange tiers than a manually keyed online order. If it doesn’t, your gateway configuration likely needs adjustment.
How does Apple Pay compare to traditional credit card processing fees?
In-store Apple Pay transactions typically cost the same or slightly less than standard chip card transactions because they qualify at card-present interchange rates. The savings come from reduced fraud (tokenization replaces the card number with a device-specific token) and potentially fewer chargebacks. Online Apple Pay transactions still incur card-not-present rates, but approval rates tend to be higher due to built-in biometric authentication.
How can merchants optimize costs when using contactless payments?
Start by confirming your contactless and mobile wallet transactions are qualifying at card-present interchange tiers. Then audit your effective rate against your quoted rate. If you process B2B transactions, enable Level 2/Level 3 data capture for lower interchange on corporate and purchasing cards. Finally, review your chargeback ratio and funding timeline, both of which affect your true cost of processing beyond the per-transaction fee.
Why do some processors charge more for the same contactless transaction?
Pricing model is the primary driver. Blended or tiered pricing bundles all transaction types into a single rate, which means you pay the same whether a customer taps a debit card or swipes a premium rewards credit card. Interchange-plus pricing passes through the actual interchange cost and adds a fixed markup, giving you visibility into what each transaction truly costs. The difference between models can be 0.2% to 0.5% per transaction.
How do chargebacks affect my processing rates over time?
High chargeback ratios (above 1%) can trigger monitoring programs from card networks, which impose additional per-transaction fees. They also signal higher risk to your acquiring bank, which may increase your processor markup at renewal or require a reserve holdback. The compounding effect means a chargeback problem today becomes a rate problem six months from now, even after the disputes are resolved.
What is an effective rate and how do I calculate it?
Your effective rate is the total processing fees you paid in a given period divided by your total processing volume. For example, if you processed $100,000 and paid $2,400 in total fees, your effective rate is 2.4%. This single number captures interchange, assessments, processor markup, and any additional surcharges. Comparing it to your quoted rate reveals whether hidden fees are inflating your costs.