
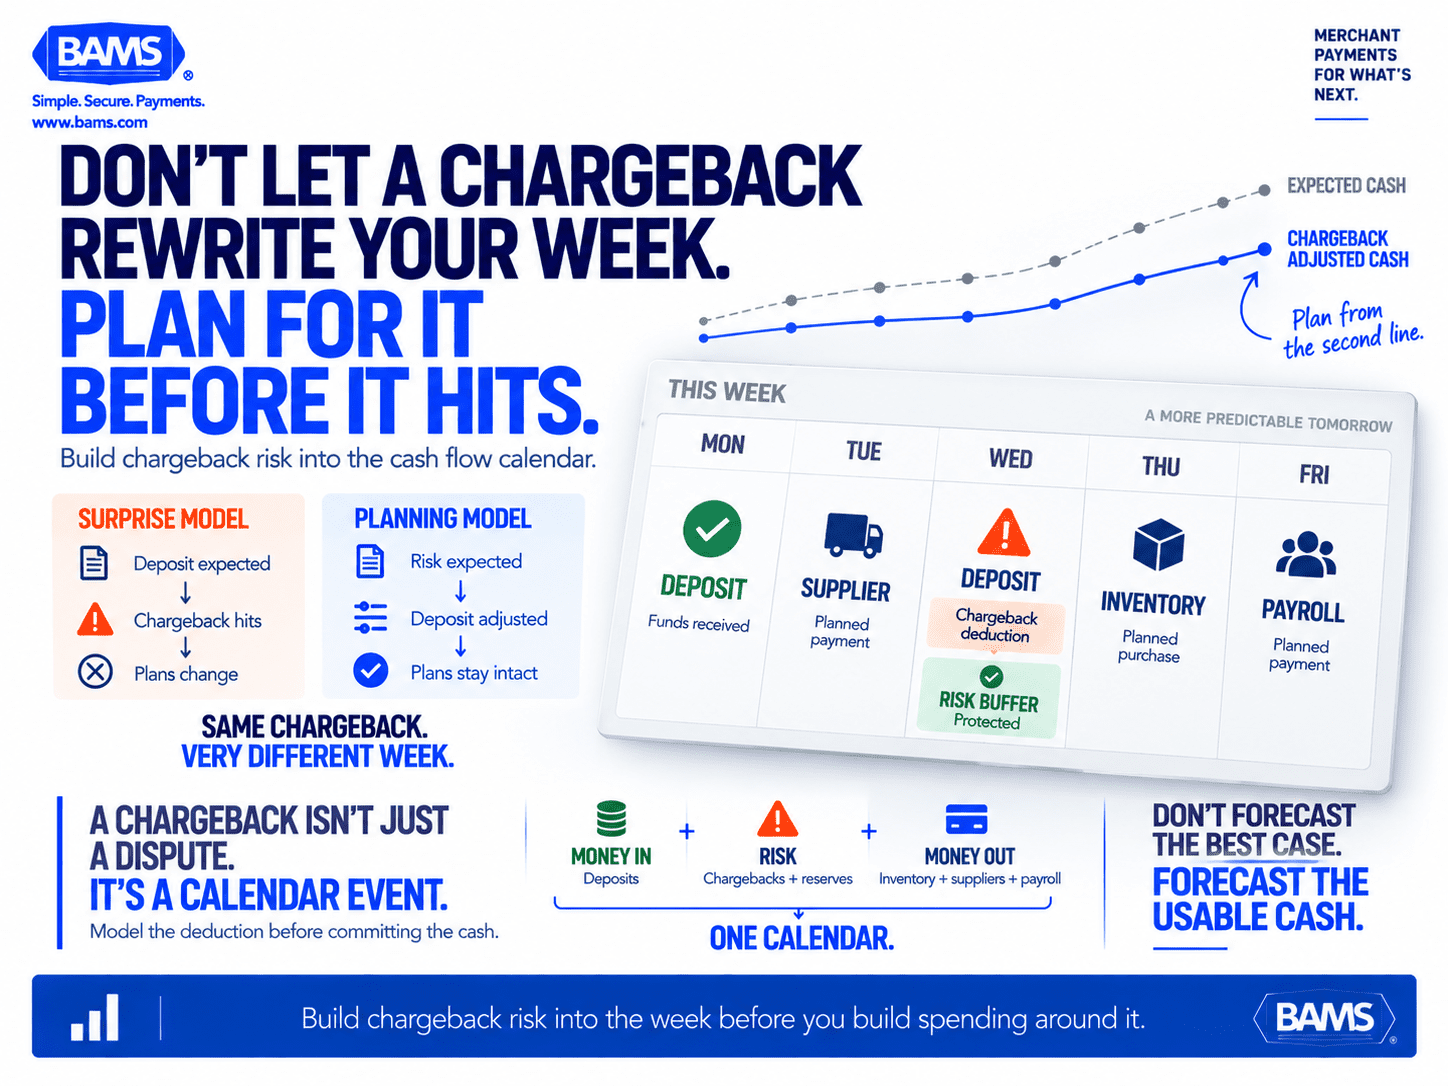
Chargeback Prevention as a Cash Flow Planning Tool
Last Updated on September 18, 2026 by Dimitri Akhrin
How to model chargeback risk into your deposit calendar and protect weekly cash flow predictability
Learn how to treat chargeback prevention as a cash flow variable rather than a dispute-management task. This guide shows eCommerce managers how to quantify chargeback timing risk, build prevention into deposit schedules, and protect working capital.
TL;DR
- Treat chargebacks as a cash flow variable, not a back-office task — Model expected chargeback losses and reserve holds as deductions in your weekly deposit forecast so surprises don’t derail supplier payments or inventory purchases.
- Prevention protects cash flow before disputes escalate – Catching disputes before they become formal chargebacks helps avoid additional costs and reduces the disruption they create in your deposit forecast.
- Faster funding compresses your risk window — Next-day funding reduces the settlement period during which a chargeback can intercept a planned deposit, giving you more certainty about when money arrives.
- Friendly fraud is a major forecasting blind spot – First-party misuse comes from legitimate purchases rather than stolen payment credentials, which makes it different from traditional payment fraud. Clear communication and proactive dispute controls help reduce the risk.
- Weekly monitoring closes the loop — Compare actual deposits to your chargeback-adjusted forecast every week, track your ratio on a rolling 30-day basis, and recalibrate prevention controls monthly to keep your deposit calendar reliable.
Guide Orientation: What This Guide Covers and Who It’s For
This guide reframes chargeback prevention as a cash flow planning discipline. Instead of treating chargebacks as isolated disputes to fight after the fact, you’ll learn to model them as a calendar variable that directly shapes your weekly deposit schedule, reserve exposure, and working capital decisions.
It’s written for eCommerce managers at established online businesses (roughly 10 to 50 employees) who already have steady transaction volume but find that unpredictable chargeback timing punches holes in otherwise optimized deposit calendars. If delayed deposits, rolling reserves, or surprise holds have ever forced you to delay a supplier payment or tap a credit line, this is for you.
By the end, you’ll be able to quantify how chargebacks disrupt your funding timeline, build a prevention framework that feeds directly into cash flow forecasting, and structure your batch and deposit cadence to absorb chargeback risk without sacrificing predictable cash flow. This guide does not cover representment strategy or dispute letter templates. It stays upstream, where the money is.
Why Predictable Cash Flow Depends on Chargeback Prevention
Chargebacks are growing. U.S. merchants faced chargeback volumes between $8 billion and $11 billion in 2023, with projections reaching $15 billion by 2026. For an eCommerce operation running on tight margins, even a modest spike in disputes can cascade through your entire financial calendar.
The real cost isn’t the chargeback fee itself. It’s the downstream disruption. When your processor withholds funds, delays a deposit, or increases your rolling reserve, you lose the ability to predict when money lands in your account. That unpredictability forces reactive decisions: dipping into credit lines, missing early-payment supplier discounts, or delaying inventory restocks that cost you revenue.
Mastercard estimates that each chargeback costs merchants an average of $128 in third-party fees and internal costs. Multiply that by dozens of monthly disputes and the aggregate cost isn’t just a line item. It’s a structural threat to your deposit calendar. Mastercard also notes that catching disputes earlier, before they become formal chargebacks, is one of the simplest ways to reduce these costs. That advice isn’t just about loss prevention. It’s about making your cash flow plannable again.
When you treat chargeback risk as a scheduling input rather than a back-office problem, you unlock the ability to forecast deposits with confidence, negotiate from strength with suppliers, and eliminate the short-term borrowing that erodes margin.
Core Concepts: Chargebacks as a Cash Flow Variable

Chargebacks become easier to manage when they stop being surprise deductions. Building expected dispute exposure into the deposit calendar gives merchants a more realistic picture of the cash they can actually plan around.
The Deposit Calendar vs. the Dispute Timeline
Your deposit calendar is the schedule on which cleared funds arrive in your bank account. It’s shaped by batch timing, processor settlement speed, and any holds or reserves your acquirer imposes. A chargeback doesn’t just reverse a single transaction. It introduces a second, adversarial timeline that can retroactively alter deposits you already planned around.
Rolling Reserves and Threshold Triggers
Most processors maintain a rolling reserve, a percentage of your daily deposits held back as collateral against future chargebacks. When your chargeback ratio climbs, your processor may increase this reserve or extend the hold period. The result: a larger share of your revenue sits in limbo, invisible to your cash flow forecast. Understanding your reserve terms is essential because they convert chargeback risk into a direct deposit reduction.
Friendly Fraud: The Forecasting Blind Spot
Visa identifies friendly fraud, also called first-party misuse, as a meaningful financial and operational risk for eCommerce merchants. Unlike true fraud involving stolen payment credentials, friendly fraud can originate from legitimate purchases that are later disputed. That makes it harder to address using traditional stolen-card fraud controls alone and capable of creating unexpected disruption in your deposit schedule.
The Distinction That Matters
Most chargeback content frames the problem as “how to win disputes.” This guide frames it as “how to prevent disputes from destabilizing your deposit schedule.” Mastercard notes that catching disputes earlier, before they become formal chargebacks, is one of the simplest ways to reduce chargeback costs. Preventing disputes and planning for the ones you can’t prevent is the path to predictable cash flow.
The Framework: Chargeback-Aware Cash Flow Planning
Chargeback-aware planning starts by measuring how disputes affect deposits, then builds that exposure into the forecast before using prevention, settlement optimization and monitoring to reduce future variance.
This guide follows a five-step framework that integrates chargeback risk directly into your deposit and cash flow planning cycle. Think of it as a loop, not a one-time fix.
- Step 1: Audit Your Chargeback Exposure — Quantify current losses and map them to your deposit calendar.
- Step 2: Build a Chargeback-Adjusted Deposit Forecast — Model expected chargebacks as a deduction in your weekly cash flow projection.
- Step 3: Implement Upstream Prevention Controls — Reduce chargeback volume at the transaction level before disputes are filed.
- Step 4: Optimize Batch Timing and Funding Speed — Structure settlement cadence to minimize the window of vulnerability.
- Step 5: Monitor, Recalibrate, and Tighten — Use chargeback data to continuously refine your forecast and prevention controls.
Each step feeds into the next. Prevention reduces the variance in your forecast. Faster funding shrinks the period during which a chargeback can disrupt a planned deposit. Monitoring closes the loop by surfacing new patterns before they become costly surprises.
Step-by-Step Breakdown: Protecting Your Deposit Calendar From Chargeback Disruptions
Step 1: Audit Your Chargeback Exposure
Objective: Establish a clear, quantified picture of how chargebacks currently affect your deposit schedule and reserve obligations.
Start by pulling your chargeback data for the past 6 to 12 months. You need three numbers: total chargeback count, total dollar value lost (including fees), and your current chargeback ratio (chargebacks divided by total transactions). Then map each chargeback to the deposit batch it affected. This tells you which days and weeks saw deposit shortfalls, and by how much.
Next, review your processor agreement for reserve terms. What percentage is held? How long? What chargeback ratio triggers an increase? Many ecommerce managers don’t realize their reserve exposure until a threshold is crossed and their effective deposit drops by 5% to 10% overnight.
Categorize your chargebacks by reason code. Separate true fraud from friendly fraud from service-related disputes (item not received, not as described). Each category has a different prevention path and a different impact on your forecast. Mastercard notes that chargebacks create both direct costs and indirect operational costs for merchants, which means the problem can reshape business decisions whether or not you’re tracking it deliberately.
Anti-patterns: Don’t aggregate chargebacks into a single monthly number. That hides the timing impact. A cluster of five chargebacks in one week hits your deposit calendar very differently than five spread across a month. Also avoid relying solely on your processor’s dashboard without cross-referencing your bank statements. Settlement discrepancies are common.
Success indicators: You can state your chargeback ratio, your average per-chargeback cost, your reserve terms, and which weeks in the past quarter saw the largest deposit shortfalls.
Step 2: Build a Chargeback-Adjusted Deposit Forecast
Objective: Create a weekly deposit projection that accounts for expected chargeback losses, reserve holds, and seasonal variance.
Take your historical chargeback rate and apply it as a deduction to your projected gross deposits. Use your own average disputed transaction value plus the costs associated with managing those disputes. Mastercard estimates an average of $128 in third-party fees and internal costs per chargeback, separate from the disputed transaction itself. Then subtract your expected chargeback exposure and reserve hold percentage to arrive at your expected net deposit.
Build in a variance buffer. If your chargeback volume fluctuates seasonally (common in eCommerce around holiday periods and promotional events), your forecast should reflect that. Use your audit data to identify which months historically produce spikes. This buffer isn’t pessimism. It’s the difference between a forecast you can plan supplier payments against and one that falls apart under pressure.
Structure this forecast on a weekly cadence, not monthly. Monthly forecasts mask the intra-month timing gaps that force you into short-term borrowing. A weekly view lets you align your deposit expectations with your actual payment obligations: payroll, supplier invoices, ad spend.
Anti-patterns: Don’t build your forecast on gross deposit projections and then treat chargebacks as a surprise deduction. That’s the pattern this entire guide exists to break. Also avoid assuming your chargeback rate is static. It’s a moving target influenced by product mix, marketing channels, and customer demographics.
Success indicators: You have a rolling weekly forecast that shows expected net deposits after chargeback losses and reserve holds, with seasonal adjustments applied. Your actual deposits land within 5% of forecast at least three out of four weeks.
Step 3: Implement Upstream Prevention Controls
Objective: Reduce chargeback volume at the point of transaction, before disputes reach your processor and affect your deposit schedule.
Prevention is the highest-leverage move in this framework because every chargeback you stop is one that never touches your reserve, never delays a deposit and never adds unnecessary dispute-management costs. Focus on three layers of prevention.
Layer 1: Transaction-level fraud filtering. Use address verification (AVS), CVV matching and velocity checks to block fraudulent orders before authorization. Be careful with over-filtering. Visa emphasizes balancing strong fraud controls with legitimate transaction approval so genuine customers aren’t unnecessarily blocked. Every false decline is lost revenue, so calibrate your thresholds based on actual fraud data, not fear. Layered security measures like real-time detection and proactive chargeback defense can accelerate deposits rather than slow them down when implemented correctly.
Layer 2: Customer communication and clarity. A significant share of friendly fraud comes from customers who don’t recognize a charge on their statement or feel they weren’t informed about a policy. Use clear billing descriptors that match your brand name. Send order confirmations and shipping notifications with tracking. Make your return policy visible before checkout, not buried in a footer link.
Layer 3: Alert and deflection services. Services like Verifi CDRN and Ethoca alerts notify you when a customer initiates a dispute, giving you a window to issue a refund before it becomes a formal chargeback. This costs less than a chargeback and keeps your ratio clean. Providers like BAMS offer proactive chargeback defense as part of their merchant services, which can intercept disputes before they hit your deposit schedule.
Anti-patterns: Don’t treat prevention as a one-time setup. Fraud patterns evolve, and your filters need regular tuning. Also don’t ignore friendly fraud because it’s “not real fraud.” It’s the largest category of chargebacks and the one most likely to disrupt your forecast.
Success indicators: Your chargeback ratio trends downward over 90 days. Your false decline rate trends downward without weakening fraud controls. You receive and act on dispute alerts before they convert to formal chargebacks.
Step 4: Optimize Batch Timing and Funding Speed
Objective: Shorten the settlement window so that deposits arrive faster, reducing the period during which a chargeback can disrupt a planned deposit.
Payment processing speed matters here for a specific reason: the longer your funds sit in the settlement pipeline, the larger the window during which a chargeback can intercept or offset them. Faster funding compresses that window and gives you more certainty about when money will be available.
Start with batch timing. Most eCommerce platforms allow you to set a daily batch cutoff time. If your cutoff is too late, your batch may miss your processor’s settlement window and push funding to the next business day, or even two days out. Review your platform’s batch settings and align them with your processor’s cutoff. For Shopify, WooCommerce, and BigCommerce merchants, this often means batching before 5 PM ET.
Next, evaluate your funding speed. Standard ACH settlement takes two to three business days. Next-day funding programs compress this to one business day. The cash flow impact is significant: on $500,000 in monthly volume, moving from three-day to next-day funding puts roughly $33,000 back into your accessible cash on any given day. That buffer can absorb chargeback-related shortfalls without forcing you to tap external credit. For a deeper look at how to speed up payment deposits without raising costs, including batch timing and authorization optimization, review the linked framework.
If you’re a B2B eCommerce operation, Level 3 processing can further accelerate cash flow by reducing interchange costs on qualifying transactions, which indirectly improves your net deposit amount.
Anti-patterns: Don’t assume faster funding is always more expensive. Many processors offer next-day funding at competitive rates, especially for merchants with strong chargeback ratios. Also don’t ignore weekend and holiday gaps. Deposits don’t settle on non-business days, so plan your cash flow calendar around actual settlement dates, not calendar dates.
Success indicators: Your batch closes within your processor’s optimal settlement window daily. Your average time-to-deposit is one business day. Your cash flow forecast accounts for non-business day gaps.
Step 5: Monitor, Recalibrate, and Tighten
Objective: Close the feedback loop by using chargeback and deposit data to continuously improve your forecast accuracy and prevention controls.
Set a weekly review cadence. Every week, compare your actual net deposits against your chargeback-adjusted forecast. Note the variance. If you’re consistently over-forecasting (actual deposits fall short), your chargeback loss estimate or reserve deduction is too conservative. If you’re under-forecasting, you may be holding too much cash in reserve buffers and missing opportunities to deploy capital.
Track your chargeback ratio on a rolling 30-day basis. Card networks like Visa and Mastercard monitor this ratio, and crossing their thresholds (typically 0.9% to 1%) triggers monitoring programs that impose additional fees and restrictions. Staying below these thresholds isn’t just about compliance. It’s about keeping your reserve terms favorable and your deposit schedule intact.
Review your prevention controls monthly. Which reason codes are increasing? Are new product categories or marketing channels driving higher dispute rates? Are your fraud filters producing more false declines than necessary? Each adjustment you make upstream flows directly into a more accurate forecast downstream. Proactive chargeback notifications from your merchant services provider can surface trends before they become ratio problems.
Anti-patterns: Don’t set up prevention controls and then ignore them for months. Chargeback patterns shift with product launches, seasonal traffic, and changes in customer acquisition channels. Also don’t treat your forecast as a static document. It should be a living tool that gets more accurate over time.
Success indicators: Your weekly forecast variance stays within 5%. Your chargeback ratio remains below card network thresholds. You can identify the source category of any chargeback spike within 48 hours.
Practical Examples: Mapping the Framework to Real Scenarios
Scenario 1: The Holiday Spike
An eCommerce apparel brand processes $200,000 per week during Q4 holiday season, up from $80,000 in Q3. Historically, their chargeback rate doubles during January as gift recipients dispute charges they don’t recognize. Without a chargeback-adjusted forecast, the brand plans January supplier payments based on December deposit levels. When January deposits drop by 12% due to chargebacks and increased reserves, they’re forced to delay a $15,000 fabric order, which pushes their spring collection launch back two weeks.
With the framework: The brand builds a January forecast that models the historical chargeback spike, reduces projected net deposits by 12%, and pre-negotiates a 15-day payment extension with the fabric supplier in November. They also implement clearer billing descriptors for gift orders during Q4, reducing January friendly fraud by 30%. The spring launch stays on schedule.
Scenario 2: The New Channel Problem
A DTC skincare brand launches on a new social media marketplace. Conversion rates are strong, but the new channel attracts a higher proportion of first-time buyers who file disputes at twice the rate of the brand’s existing customer base. Within six weeks, their chargeback ratio crosses 0.8%, triggering a processor warning and a reserve increase from 5% to 8%.
With the framework: The brand’s weekly monitoring (Step 5) catches the ratio increase at week three. They segment chargeback data by acquisition channel and identify the new marketplace as the source. They implement additional verification for marketplace orders (Step 3) and adjust their deposit forecast to reflect the higher reserve (Step 2). The ratio stabilizes at 0.6% within 30 days, and the reserve reverts to 5%.
Common Mistakes and Pitfalls
The most common mistake is treating chargebacks as a cost center rather than a cash flow variable. When chargebacks live in a “disputes” silo, disconnected from your deposit forecast, every spike is a surprise. Integrating them into your financial planning eliminates the surprise, even if it doesn’t eliminate the chargebacks themselves.
Another frequent error is over-investing in representment (fighting disputes after they’re filed) while under-investing in prevention. Mastercard recommends catching disputes earlier in the process before they become formal chargebacks. Shift more of your resources upstream so fewer disputes reach the stage where they can disrupt your deposits.
Finally, many eCommerce managers assume their processor’s default settings are optimal. They’re not. Batch timing, reserve terms, and funding speed are all negotiable or configurable. Accepting defaults is accepting unnecessary cash flow drag.
What to Do Next
Start with Step 1. Pull your chargeback data for the past six months and map each dispute to the deposit batch it affected. This single exercise will reveal how much cash flow disruption you’re absorbing without realizing it. From there, build your first chargeback-adjusted weekly forecast and see how it compares to your current projection.
You don’t need to implement every prevention control at once. Pick the layer (fraud filtering, customer communication, or alert services) that addresses your largest chargeback category and focus there first. Revisit this guide as your data accumulates and your forecast tightens.
Treat this framework as a reference you return to quarterly, not a checklist you complete once. Chargeback patterns evolve, your product mix shifts, and your cash flow needs change. The goal isn’t perfection. It’s building a deposit calendar you can plan against with confidence.
Frequently Asked Questions
How do chargebacks affect my deposit schedule beyond the direct dollar loss?
Beyond the reversed transaction amount and the chargeback fee (averaging $165 per dispute), chargebacks can trigger reserve increases from your processor. A higher reserve means a larger percentage of your daily deposits is withheld, reducing the cash that actually lands in your bank account. If your chargeback ratio crosses card network thresholds, you may also face additional monitoring fees and restrictions that further delay or reduce deposits.
What is a chargeback-adjusted deposit forecast?
It’s a weekly projection of your expected net deposits that subtracts estimated chargeback losses and reserve holds from your gross deposit total. Instead of forecasting based on sales volume alone, you model chargebacks as a known deduction, similar to how you’d account for processing fees. This gives you a realistic view of the cash available for supplier payments, payroll, and inventory purchases each week.
How does next-day funding help protect against chargeback disruptions?
Next-day funding compresses the settlement window, meaning your cleared funds arrive in your bank account one business day after the batch closes. This reduces the time during which a chargeback can intercept or offset a deposit. It also improves your overall cash position, giving you a larger buffer to absorb chargeback-related shortfalls without resorting to credit lines or delaying payments.
What’s the difference between preventing chargebacks and fighting them through representment?
Prevention stops a dispute before it’s filed, using tools like fraud filters, clear billing descriptors, and alert services. Representment is the process of contesting a chargeback after it’s been filed by submitting evidence to the card network. Prevention is significantly more cost-effective because win rates on fraud-coded chargebacks sit below 20%, and even successful representment doesn’t undo the cash flow disruption caused by the initial hold.
How often should I review my chargeback data and adjust my forecast?
Review your chargeback data weekly as part of your deposit reconciliation. Compare actual net deposits to your forecast and note the variance. Adjust your chargeback loss estimates monthly based on trends, and do a full audit of your prevention controls and reserve terms quarterly. This cadence keeps your forecast accurate and catches emerging problems (like a new sales channel driving higher dispute rates) before they escalate.
Can optimizing batch timing really make a difference in cash flow?
Yes. If your batch closes after your processor’s settlement cutoff, your funds may not begin the ACH process until the next business day, adding 24 hours (or more over weekends) to your deposit timeline. Aligning your batch cutoff with your processor’s optimal window ensures you’re in the fastest possible settlement cycle. On significant monthly volume, this can mean tens of thousands of dollars in additional accessible cash on any given day.


