Payout Holds: How to Forecast Your Real Cash Flow
What You’ll Achieve: A Week-by-Week Cash Flow Forecast Built on Your Own Transaction Data
By the end of this tutorial, you’ll have a working payout hold forecast: a spreadsheet model that maps your payout holds against your actual transaction patterns. This model will let you forecast your real available cash on a weekly basis, not just your gross sales. You’ll see exactly how much of your revenue is locked in reserves at any given moment, when those funds release and how your growing volume can actually work in your favor to reduce hold percentages over time.
Your success criteria: a completed payout hold forecast that predicts your usable merchant cash flow within 5% accuracy for the next four weeks, plus a documented action plan for negotiating lower reserve requirements with your processor.
TL;DR
- Your payout holds are predictable – Export 90 days of settlement data and you can map exactly how much cash is locked in reserves at any point and when it releases.
- Build a weekly forecast model – Use your effective reserve rate and weekly volume patterns to project available cash for the next four weeks, aiming for 5% accuracy.
- Track your risk metrics for negotiation leverage – Chargeback ratio, refund rate, volume growth and processing tenure are the inputs processors use to set reserves. Document them and request formal reviews every 90 to 180 days.
- Separate settlement delays from contractual reserves – These are different mechanisms that both affect your cash flow. Mixing them up produces inaccurate forecasts and missed negotiation opportunities.
- Faster settlement terms compound the benefit – Reducing your reserve percentage matters, but shortening hold duration and settlement timing (like moving to next-day funding) has an outsized impact on your real available cash.
Prerequisites and Setup
What You Need Before Starting
- Spreadsheet tool (Google Sheets, Excel, or similar)
- 90 days of transaction history from your payment processor dashboard (settlement reports, not just sales reports)
- Your current reserve terms (reserve percentage, hold duration and release schedule, found in your merchant agreement or processor portal)
- Chargeback and refund data for the same 90-day window
- 30 minutes for initial setup, then 15 minutes weekly to maintain
Potential blockers: If your processor doesn’t provide itemized settlement reports, contact your account manager and request a detailed payout breakdown. Many processors can generate this on request. If you can’t locate your reserve terms, check your original merchant application or the “funding” section of your processor portal.
Why This Approach Works for Growing eCommerce Businesses
Roughly four in five small firms faced challenges related to customer payments in 2023, making payment timing a material cash flow risk. Yet most merchants treat reserve holds as a black box controlled entirely by their processor. That’s a mistake. Your payout holds follow predictable patterns tied to your own transaction volume, chargeback ratios and processing history.
This tutorial takes a system-level approach. Instead of guessing when funds will arrive, you’ll build a model from observable data you already have. The goal isn’t to eliminate reserves (they exist for legitimate risk reasons) but to turn them from an unpredictable drain into a forecasted, manageable variable. Alternative approaches like simply holding extra cash in reserve or relying on credit lines are more expensive and less precise.
Step 1: Export and Organize Your Settlement Data
Action: Log into your payment processor’s dashboard and export your settlement or funding reports for the past 90 days. You need the date each transaction was processed, the date funds were deposited and any amounts withheld.
Create a spreadsheet with these columns: Transaction Date, Settlement Date, Gross Amount, Fees Deducted, Reserve Withheld, Net Deposited. Then populate each row from your export. If your processor lumps transactions into daily batches, use the batch-level data.
Expected result: A clean table showing every settlement over 90 days with the gap between transaction and deposit clearly visible.
Common failure: Some exports include only net deposits without breaking out the reserve amount. If that’s the case, calculate the reserve by subtracting (Net Deposited + Fees) from Gross Amount.
Step 2: Calculate Your Actual Hold Duration
Action: For each row, add a column called Hold Days. Calculate this as the number of calendar days between the Transaction Date and the Settlement Date. Then create a second column called Reserve Release Date using your contractual reserve term (e.g., if you have a 180-day rolling reserve, add 180 days to the Transaction Date).
Hold Days = Settlement Date - Transaction Date
Reserve Release Date = Transaction Date + Reserve Term (in days)
Checkpoint: Your average Hold Days should roughly match your processor’s stated settlement timeline (typically 1 to 3 business days for standard deposits). If the average is significantly higher, flag those delayed batches for investigation.
Common failure: Weekends and holidays inflate calendar-day counts. If you want business-day accuracy, use the NETWORKDAYS function in your spreadsheet. For this forecast, calendar days are sufficient since you’re planning around actual cash availability.
Step 3: Map Your Weekly Transaction Volume Pattern
Action: Add a column for Week Number (use the WEEKNUM function on the Transaction Date). Then create a pivot table or summary that shows total Gross Amount, total Reserve Withheld and transaction count per week.
Next, sort this summary chronologically. You’re looking for your weekly volume pattern: do sales spike on certain weeks? Is there a consistent growth trend? Are there seasonal dips?
Expected result: A 13-row summary (one per week over 90 days) showing your volume trajectory and the corresponding reserve amounts held each week.
Common failure: If you run promotions or had a product launch during this window, those weeks will skew your baseline. Mark anomaly weeks with a flag column so you can exclude them from trend calculations later.
Step 4: Build Your Reserve Balance Tracker
Action: Create a new sheet called Reserve Balance. For each week, calculate: Reserves Added (that week’s withheld amount) and Reserves Released (the withheld amount from the week whose reserve term expires). Your running reserve balance is:
Current Reserve Balance = Previous Balance + Reserves Added - Reserves ReleasedIf you have a 90-day rolling reserve and exactly 90 days of data, your first releases arrive right after the window ends, so project them forward. If your reserve term is longer (120 or 180 days), you may not have releases yet. In that case, project forward using your earliest weeks’ withheld amounts as the release values.
Checkpoint: Your calculated reserve balance should approximately match the “held funds” or “reserve balance” figure in your processor dashboard. If it’s off by more than 10%, double-check that you’ve captured all withheld amounts, including any one-time security holds.
Step 5: Calculate Your Effective Reserve Rate
Action: For each week, divide the Reserve Withheld by the Gross Amount to get your Effective Reserve Rate. Then calculate the 90-day average.
Effective Reserve Rate = Reserve Withheld / Gross Amount × 100Next, compare this to your contractual reserve rate. They should match closely. If your effective rate is higher than your contract states, your processor may be applying additional discretionary holds. In that case, document these discrepancies.
Expected result: A single percentage that represents how much of every dollar you process is currently being held back. This is the key input for your cash flow forecast.
Common failure: Some processors apply tiered reserves (higher percentages for international transactions or certain card types). If your effective rate varies widely week to week, break your data into domestic vs. international or card-present vs. card-not-present segments.

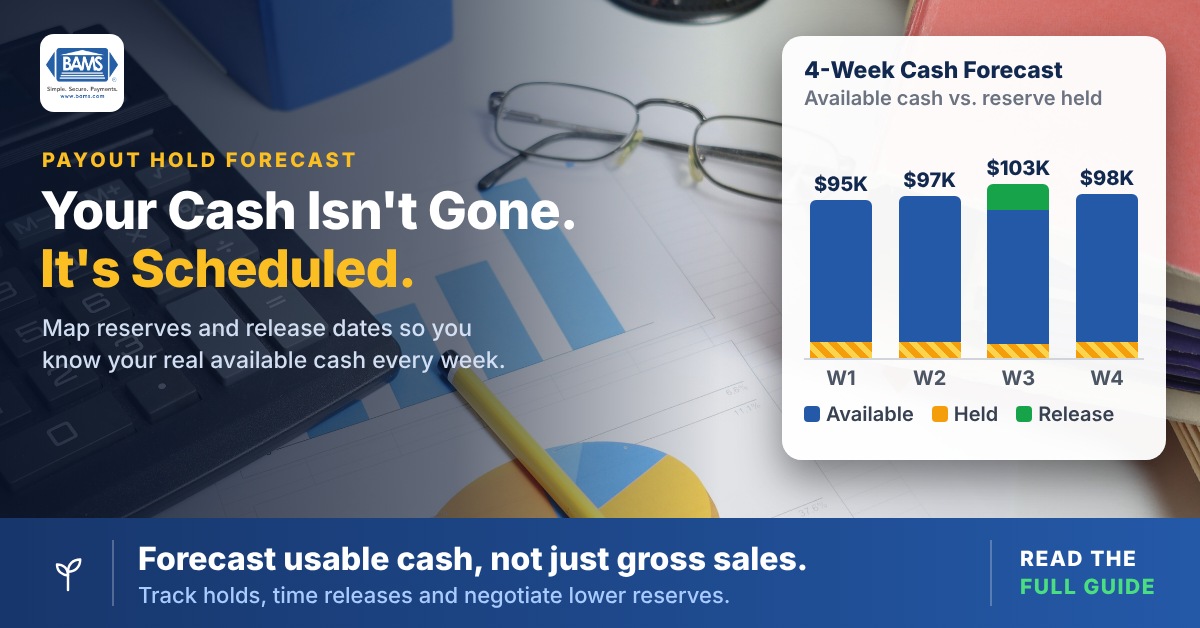
In an illustrative week, $100K in gross volume becomes $95K of usable cash after $3K in fees, $10K in new reserve and $8K in scheduled releases.
Step 6: Forecast Your Available Cash for the Next Four Weeks
Action: Create a new sheet called Cash Forecast. For each of the next four weeks, estimate your Gross Volume using your weekly trend from Step 3. Apply your Effective Reserve Rate to calculate expected holds. Add in any reserve releases scheduled from your Reserve Balance tracker.
Projected Available Cash = Projected Gross Volume - Projected Fees - Projected Reserve Withheld + Scheduled Reserve ReleasesThen fill in four rows, one per week. Use conservative volume estimates (your 90-day weekly average) unless you have confirmed order data suggesting otherwise.
Checkpoint: Your Week 1 forecast should be verifiable against actual deposits within 7 days. If it’s accurate within 5%, your model is calibrated. If not, revisit Steps 2 and 5 for data gaps.
For merchants using processors that offer next-day funding, such as BAMS for qualifying merchants, the Hold Days variable in your model compresses, which narrows the gap between gross sales and usable cash. A shorter, steadier gap makes your payout hold forecast easier to keep accurate.
Step 7: Document Your Risk Profile for Negotiation
Action: On a new sheet called Risk Summary, compile these metrics from your 90-day data:
- Chargeback ratio: Total chargebacks ÷ Total transactions (target: below 0.65%)
- Refund rate: Total refunds ÷ Total gross volume
- Average transaction size: Total gross volume ÷ Transaction count
- Volume growth rate: Week-over-week percentage change in gross volume
- Processing tenure: Months you’ve been with your current processor
These are core metrics processors weigh when they set and adjust your reserve requirements. Card network programs set the outer limits (Visa’s VAMP threshold for U.S. merchants is 1.5% from April 1, 2026), but processors act well before that. When your chargeback ratio stays consistently below 0.65% and your volume grows steadily without spikes, you have leverage to request a reduction in your rolling reserve percentage or a shorter hold duration.
Expected result: A one-page summary you can share with your processor’s risk team or account manager during a review call.
Step 8: Schedule Your Reserve Review Request
Action: Using your Risk Summary, draft a brief email or talking points for your processor’s account manager. Request a formal reserve review. Include:
- Your current reserve rate and hold duration
- Your 90-day chargeback ratio and refund rate
- Volume trajectory showing consistent growth
- A specific ask (e.g., “reduce reserve from 10% to 5%” or “shorten hold from 180 to 90 days”)
Many processors will review reserves on request, often every 90 to 180 days. If your processor doesn’t proactively schedule reviews, you need to initiate them. The data you’ve built in Steps 1 through 7 gives you a stronger position than simply asking “can you lower my reserve?”
Common failure: Requesting a review during or immediately after a chargeback spike. Wait until you have at least 60 consecutive days of clean data after any incident. For a deeper look at how chargeback risk management directly impacts your reserve terms, review your dispute prevention strategy before initiating this conversation.
Configuration and Customization
Adjusting the Model for Your Business
Reserve term length: Replace the default 180-day value with your actual contractual term. Common values are 90, 120, or 180 days. If you’re unsure, use 180 as a conservative default.
Volume projection method: The tutorial uses a simple weekly average. If your business is seasonal, weight recent weeks more heavily or use a 4-week moving average instead. For businesses with strong growth curves, apply your week-over-week growth rate to the most recent week’s volume.
Fee estimation: Use your blended processing rate (total fees ÷ total volume over 90 days) as a flat percentage. This simplification works well for forecasting. If your fee structure changes after peak season, update this rate quarterly.
Must-change settings: Your reserve percentage and hold duration must reflect your actual contract terms. Using defaults here will produce an inaccurate payout hold forecast.
Verification and Testing
How to Confirm Your Forecast Is Accurate
Test procedure: At the end of Week 1, compare your forecasted Available Cash to the actual deposits received. Calculate the variance as a percentage: (Actual – Forecast) ÷ Forecast × 100. If variance is within ±5%, your model is calibrated.
Next, run this comparison for four consecutive weeks. If accuracy degrades over time, your volume projection method likely needs adjustment. Recalibrate by updating your weekly average with the most recent actual data.
Edge cases to verify: Test your model against a week that included a chargeback, a week with a refund spike and a week where your processor applied an additional discretionary hold. If any of these scenarios produce a variance greater than 10%, add a buffer line item for “unexpected holds” set at 2% of weekly volume.
Common Errors and Fixes for Payout Hold Forecasting
Troubleshooting Your Model
Symptom: Reserve balance in your model is significantly higher than what your processor shows. Cause: You may be double-counting holds that are part of standard settlement delays rather than formal reserves. Fix: Separate settlement timing (Hold Days) from contractual reserve withholding. Only count amounts explicitly labeled as “reserve” or “held funds” in your processor reports.
Symptom: Forecast consistently overestimates available cash. Cause: Fees are higher than your blended rate estimate, or your processor is applying holds you haven’t captured. Fix: Reconcile one full week of deposits line by line against your processor’s settlement detail. Update your fee rate and check for any additional payout holds not reflected in your reserve terms.
Symptom: Reserve release dates pass but funds don’t appear. Cause: Your processor may have extended the reserve term due to a risk event (chargeback spike, rapid volume increase, or compliance flag). Fix: First, contact your account manager immediately. Ask for written confirmation of your current reserve terms and any changes. Document the response and update your model.
Symptom: Week-over-week volume projections are wildly inaccurate. Cause: Your business has high variability (flash sales, seasonal swings, or inconsistent marketing spend). Fix: Switch from a flat average to a weighted moving average, or input known upcoming promotions as manual overrides in your forecast weeks.
Next Steps: Extending Your Cash Flow Advantage
Once your payout hold forecast is running and validated, you have several paths forward. First, automate the data input by connecting your processor’s API or CSV exports to your spreadsheet on a weekly schedule. This cuts maintenance time to under 5 minutes per week.
Second, use your Risk Summary to negotiate not just lower reserves but also faster settlement terms. Processors that see consistent, low-risk processing history may be willing to move merchants to faster funding, such as next-day deposits.
Third, integrate this forecast into your broader treasury management. Layer in payroll dates, supplier payment terms and marketing spend to build a complete picture of your weekly cash position. The reserve forecast becomes one input in a larger operational model that gives you control over your growth trajectory rather than reacting to cash surprises.
Frequently Asked Questions
What is reserve and hold management in merchant services?
Reserve and hold management refers to the practice of tracking, forecasting and negotiating the funds your payment processor withholds from your settlements. Processors hold a percentage of your transaction volume (called a rolling reserve) as protection against chargebacks and refunds. Managing this process means understanding how much is held, when it releases and how to reduce the percentage over time based on your risk performance.
Why do payment processors withhold reserves from merchants?
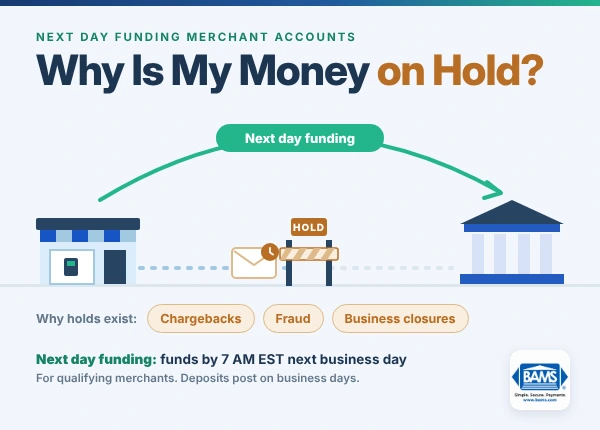
Processors withhold reserves to protect themselves from financial exposure if a merchant experiences high chargebacks, fraud, or sudden business closure. The reserve acts as a buffer fund. The percentage and duration are based on your perceived risk profile, which includes factors like your industry, chargeback ratio, processing history, average transaction size and how long you’ve been with the processor.
How do rolling reserves work in payment processing?
A rolling reserve withholds a set percentage of each day’s transactions for a defined period (commonly 90 to 180 days). After that period, the held funds from each specific day are released back to you. This means at any given time, you have a “pool” of held funds that is constantly being added to and released from. The balance grows as your volume grows, which is why forecasting matters.
When can a merchant expect to have their reserves released?
Release timing depends on your contractual reserve term. For a 180-day rolling reserve, funds from a specific transaction date release 180 calendar days later. Some processors offer shorter terms (90 or 120 days) based on risk assessment. You can request a reserve review after demonstrating consistent low-risk processing for 90 or more consecutive days.
Which factors influence the percentage of reserves withheld by payment processors?
The primary factors are your chargeback ratio, refund rate, industry risk classification, average transaction size, monthly processing volume and tenure with the processor. Rapid volume spikes, international transactions and high-ticket items can also trigger higher reserve percentages. Maintaining a chargeback ratio below 0.65% and demonstrating steady volume growth are the most effective ways to qualify for lower rates.
How can merchants reduce their reserve requirements over time?
Build a documented track record of low chargebacks, stable volume and clean processing. Use the data from your settlement reports to create a Risk Summary (as outlined in this tutorial) and proactively request a reserve review every 90 to 180 days. Specific asks (like reducing from 10% to 5% or shortening the hold from 180 to 90 days) backed by data are far more effective than general requests. Working with a processor that offers dedicated account representatives can also make the review process easier.