Transaction Volume Forecasting for Seasonal Cash Flow
Last Updated on September 23, 2026 by Dimitri Akhrin
Align processing cost spikes with your funding timeline so peak season profits land in your bank account
Learn how to build a transaction volume forecasting model tied to your deposit schedule, spot hidden triggers that cause payment holds during high-volume periods, and implement cost reduction initiatives focused on cash flow timing rather than rate negotiation.
TL;DR
- Seasonal processing costs are a timing problem, not just a rate problem – When volume spikes, the 2-3 day gap between when fees are deducted and when deposits arrive creates cash flow crunches that can stall fulfillment and advertising at the worst possible moment.
- Forecast daily, not monthly – Build a transaction volume forecast that maps projected sales to your exact deposit schedule, so you can see which specific days your cash position will be tightest during peak periods.
- Next-day funding is the highest-leverage change – Cutting deposit delays from 3 days to 1 day during a peak weekend can free up tens of thousands in working capital that would otherwise be stuck in the processing pipeline.
- Preempt processor risk flags 60-90 days out – Contact your processor with a written volume forecast and request increased limits before peak season. Surprise volume spikes trigger reserve holds that can freeze 5-10% of your deposits.
- Flatten your effective rate through card mix and routing – Shift eligible transactions to debit or ACH, ensure you’re on interchange-plus pricing, and submit Level 2/3 data on B2B orders to qualify for lower interchange categories during high-volume periods.
Guide Orientation: What This Covers and Who It’s For
This guide addresses the specific cash flow timing problem that eCommerce businesses face when payment processing costs spike during seasonal volume peaks. It’s built for eCommerce managers at established online businesses (roughly 10-50 employees) who have already survived a few peak seasons but keep getting blindsided by the gap between what they spend on processing and when deposits actually land.
By the end, you’ll understand how to build a transaction volume forecasting model tied to your funding timeline, identify the hidden triggers that cause processors to hold your money during high-volume periods, and implement cost reduction initiatives that address timing rather than just rates. This guide does not cover enterprise-level payment optimization or basic checkout UX tips. It focuses on the operational and financial mechanics that determine whether your peak season profits exist on paper or in your bank account.
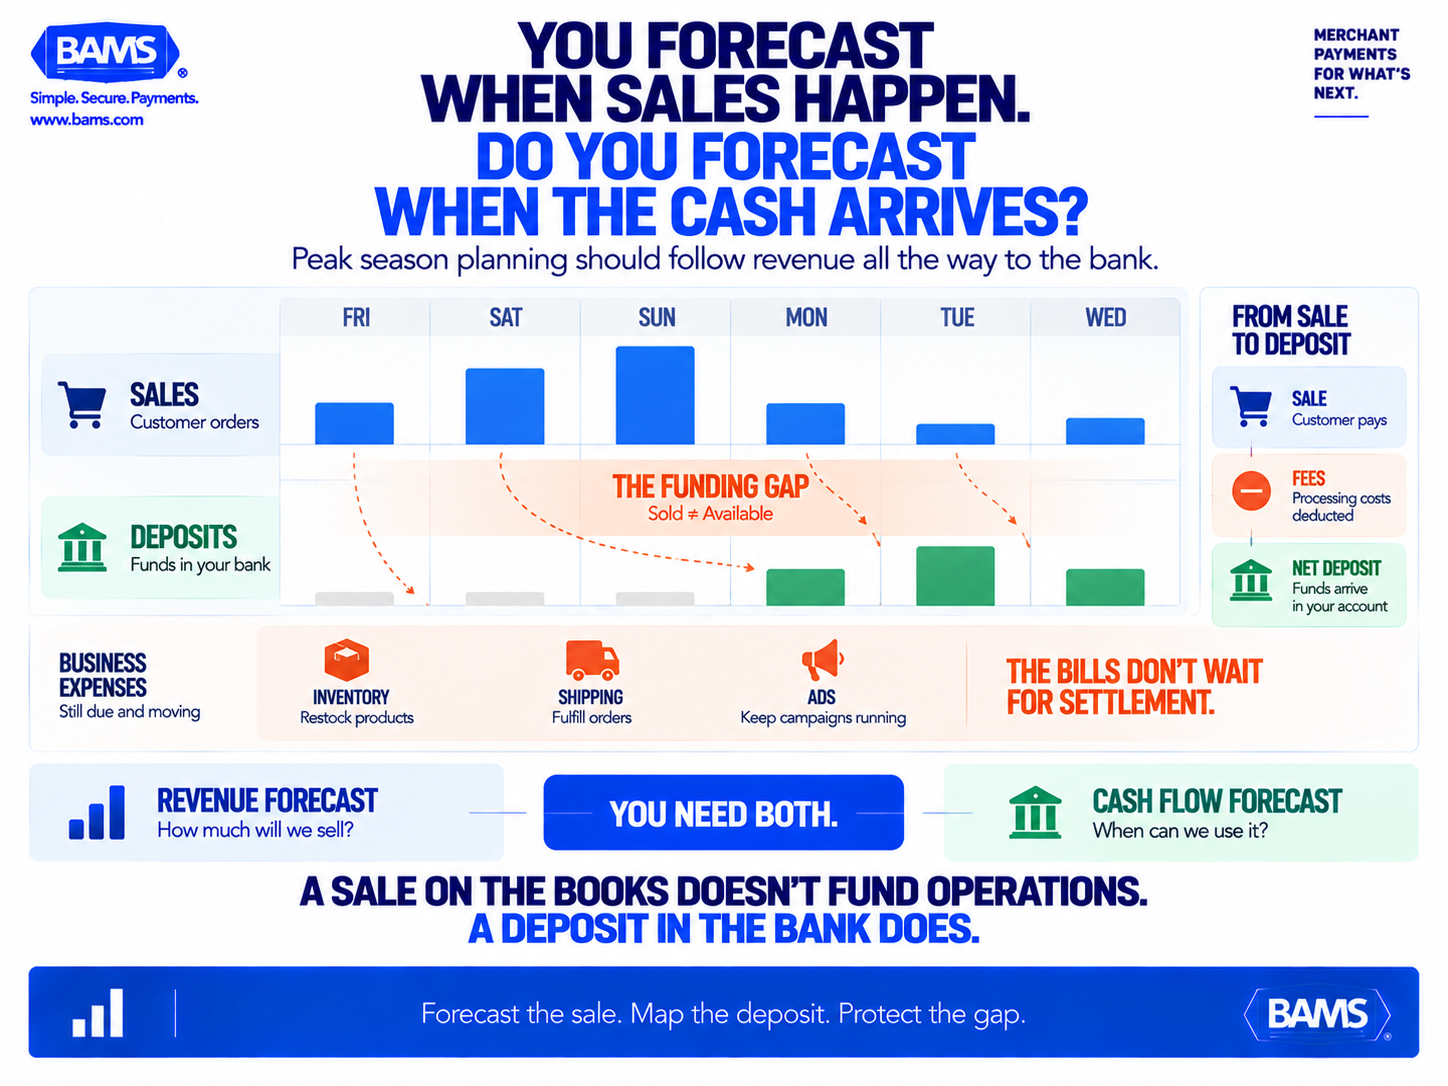
A sales forecast tells you when customers buy. A cash flow forecast tells you when that revenue becomes usable. During peak season, the gap between those dates can determine how aggressively a business can fulfill, restock and advertise.
Why Seasonal Processing Costs Are a Cash Flow Problem, Not a Rate Problem
Most eCommerce businesses treat processing costs as a fixed percentage they negotiate once and forget. That works fine at steady-state volume. But during a seasonal spike, the math changes in ways that can quietly drain working capital at the worst possible time.
Consider the scale: U.S. merchants paid a record $187.20 billion in processing fees in 2024, up 8.7% year over year. The weighted average processing fee rate reached 1.59% of purchase volume that same year. For a mid-size eCommerce brand doing $3 million in annual sales with 40% concentrated in Q4, that’s roughly $19,000 in processing fees hitting during a 90-day window when you’re also paying for inventory, shipping, ad spend, and seasonal staff.
The real problem isn’t the rate. It’s that most processors batch deposits on a 2-3 business day delay, meaning you’re funding operations with capital you haven’t received yet. During a holiday weekend when transaction volume might surge 50-100%, that delay compounds. You’re essentially extending an interest-free loan to your processor while borrowing from your own reserves to cover fulfillment.
The St. Louis Fed reports that U.S. banks collected nearly $66 billion in interchange fees in 2025, up from $64 billion in 2024 and $52 billion in 2021. This makes processing cost exposure a margin issue that becomes more significant as transaction volume grows. The cost of inaction isn’t just higher fees. It’s the opportunity cost of capital you can’t deploy because it’s sitting in a processing pipeline.
Core Concepts: The Mechanics Behind Seasonal Cost Spikes
Processing Fees Scale Linearly, Cash Flow Doesn’t
When your volume doubles during peak season, your processing fees double too. But your deposit schedule doesn’t accelerate to match. If you’re on a standard 2-3 day funding cycle, a $50,000 sales day generates roughly $795 in processing fees (at the 1.59% average) that gets deducted before you see the deposit. Multiply that across a 30-day peak, and you’ve prepaid $23,850 in fees from working capital before the revenue fully cycles through.
Risk Flags and Reserve Holds
Here’s what catches most growing eCommerce brands off guard: processors use automated risk systems that flag unusual volume spikes. If your average monthly processing is $200,000 and you suddenly push $500,000 in November, your processor may place a rolling reserve (typically 5-10% of transactions) or delay deposits pending manual review. This isn’t malice. It’s risk management. But it can freeze tens of thousands of dollars at the exact moment you need them for fulfillment.
Card Mix Shifts During Peak Season
Credit cards accounted for 79.34% of all merchant processing fees paid in 2024. During peak seasons, consumers tend to use credit cards more heavily (rewards programs, buy-now-pay-later alternatives, higher purchase amounts). This shifts your card mix toward higher-cost transactions, increasing your effective rate even if your contracted rates haven’t changed.
The Forecasting Gap
Transaction volume forecasting isn’t just about predicting how many orders you’ll process. It’s about mapping those transactions to your deposit schedule, fee structure, and working capital needs. Most eCommerce businesses forecast revenue but not the cost and timing of receiving that revenue. That gap is where seasonal cash flow problems live.
The Framework: Forecast, Fund, Flatten
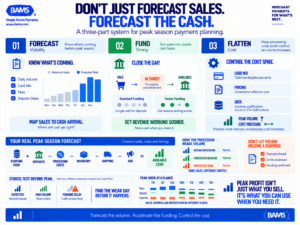
Seasonal payment planning connects three things: how much you expect to process, when that revenue becomes available and how much processing costs along the way. The Forecast, Fund, Flatten framework brings all three together.
This guide uses a three-phase framework for managing seasonal processing cost exposure. Each phase addresses a different layer of the problem.
- Forecast: Build a transaction volume model that predicts not just sales but fee exposure, card mix shifts, and deposit timing across your peak period. This is your visibility layer.
- Fund: Align your deposit speed and funding structure so that incoming revenue matches outgoing operational costs as closely as possible. This is your timing layer.
- Flatten: Implement structural changes to your processing setup that reduce the per-transaction cost impact of volume spikes. This is your cost layer.
The phases are sequential in planning but overlap in execution. You forecast before peak season, adjust funding structures 60-90 days out, and implement cost-flattening measures on an ongoing basis. The key insight is that all three phases must connect. A great rate means nothing if your deposits are delayed, and fast deposits don’t help if your effective rate is 30% higher than you budgeted.
Step-by-Step Breakdown: Building Your Seasonal Processing Cost Strategy
Step 1: Map Your Historical Volume Curve and Fee Exposure
Objective: Establish a baseline that shows exactly how your processing costs behaved during previous peak periods, broken down by week, card type, and effective rate.
Pull your processing statements from the last two peak seasons. Don’t just look at total volume. Break it down by week, because seasonal spikes aren’t uniform. You might see 60% of your November volume concentrated in the final 10 days. That concentration matters for cash flow planning.
Calculate your effective rate for each week by dividing total fees, including interchange, assessments and processor markup, by total volume. Your effective rate can change as your transaction mix and qualification criteria change. Mastercard explains that interchange qualification depends on factors including product type, merchant category, authorization-to-clearing timing, enhanced transaction data and transaction volume. Tracking these changes week by week gives you a more accurate view of your actual peak-season processing costs.
If your statements are hard to parse, that’s a signal in itself. Many businesses underestimate their true processing costs by 20-40% because of hidden fee layers that only become visible under scrutiny.
Anti-patterns: Don’t use your annual average rate for seasonal projections. Don’t ignore assessment fees and network charges, which fluctuate independently of your processor’s markup. Don’t assume this year’s card mix will match last year’s.
Success indicators: You have a week-by-week volume and fee model for your last two peak periods, with effective rates calculated for each week. You can identify the specific weeks where fee exposure was highest relative to deposit timing.
Step 2: Build a Transaction Volume Forecast Tied to Your Funding Timeline
Objective: Create a forward-looking model that predicts daily transaction volume, fee deductions, and net deposit amounts for your upcoming peak period.
Start with your marketing calendar. Map every planned promotion, product launch, and ad spend increase to expected transaction volume. Use your historical data as a multiplier, not a guess. If last year’s Black Friday email campaign drove 3.2x your average daily volume, use that as your baseline and adjust for any changes in list size, ad budget, or product mix.
Now layer in your deposit schedule. For each projected sales day, calculate when the net deposit (sales minus fees) will actually hit your bank account. If you’re on a 2-day funding cycle, Wednesday’s sales arrive Friday. Thursday’s sales arrive Monday. Friday through Sunday’s sales might not arrive until Tuesday or Wednesday of the following week. During a peak weekend, that creates a 4-5 day gap between when you incur fulfillment costs and when you receive revenue.
This is where transaction volume forecasting becomes a cash flow tool rather than a sales projection. You’re not just asking “how much will we sell?” You’re asking “when will we have the money, and what do we need to spend before it arrives?”
Anti-patterns: Don’t forecast monthly. Forecast daily during peak periods. Don’t ignore weekends and bank holidays, which create deposit gaps. Don’t treat your deposit schedule as fixed without confirming it with your processor.
Success indicators: You have a daily projection showing expected sales, fee deductions, and net deposit arrival dates for your entire peak period. You can identify the specific days where your cash position will be tightest.
Step 3: Accelerate Deposit Speed to Close the Funding Gap
Objective: Reduce the time between transaction and deposit so that peak-season revenue arrives before (or at least concurrent with) peak-season expenses.
The single highest-leverage change you can make for seasonal cash flow is moving from standard 2-3 day funding to next-day funding. This isn’t about convenience. It’s about eliminating the compounding deposit gap that turns profitable peak weekends into cash flow crunches.
Run the math on your forecast from Step 2. If you project $80,000 in sales over a peak weekend (Friday through Sunday), standard funding means that money arrives Tuesday through Wednesday at the earliest. With next-day funding, Friday’s sales arrive Saturday or Monday, and you’ve cut the gap from 4-5 days to 1-2 days. On $80,000 at a 1.59% effective rate, you’re recovering access to roughly $78,728 one to three days faster. That’s capital you can deploy for restocking, shipping, or ad spend instead of covering with reserves or credit lines.
BAMS offers next-day funding as a standard feature for merchants, which directly addresses this timing problem. If your current processor holds deposits for 48-72 hours during peak periods, that’s worth quantifying as a cost, because the opportunity cost of delayed capital is real even if it doesn’t appear on your processing statement.
Anti-patterns: Don’t assume your current funding speed is the best available. Don’t overlook that some processors slow down funding during high-volume periods as a risk measure. Don’t treat deposit speed as a “nice to have” when your forecast shows cash gaps.
Success indicators: You’ve confirmed your exact deposit timeline with your processor, including any holiday or weekend delays. You’ve calculated the dollar value of closing the funding gap during your peak period. You’ve either secured next-day funding or identified the specific steps to get it.
Step 4: Preempt Processor Risk Flags and Reserve Holds
Objective: Prevent your processor from freezing funds or imposing reserve requirements during your highest-volume period.
This is the step most eCommerce businesses skip entirely, and it’s the one that causes the most damage. Processors use automated systems to detect unusual activity. If your volume spikes 150% above your approved monthly limit, the system may automatically hold a percentage of your deposits in reserve or flag your account for manual review. During peak season, “manual review” can mean 3-5 business days of frozen funds.
The fix is proactive communication. Contact your processor 60-90 days before your peak season and provide a written volume forecast. Request a temporary increase to your approved monthly processing limit. Include supporting documentation: last year’s peak volume, your marketing calendar, and projected daily transaction counts. Most processors will accommodate this if you give them advance notice. The ones that won’t are telling you something about how they’ll treat you when problems arise.
Also review your chargeback ratio. Processors tighten risk controls on accounts with elevated chargeback rates, and peak season often brings higher dispute volumes from gift purchases, shipping delays, and buyer’s remorse. BAMS provides proactive chargeback defense that helps merchants address disputes before they escalate, which keeps your risk profile clean during the exact period when you can least afford a hold.
Anti-patterns: Don’t wait until your account is flagged to contact your processor. Don’t assume your approved volume limit is high enough for peak season. Don’t ignore chargeback trends in the months leading up to your peak period.
Success indicators: You’ve received written confirmation of your increased volume limit. Your chargeback ratio is below 1% (ideally below 0.5%). You have a named contact at your processor who can intervene if a hold is triggered.
Step 5: Flatten Your Effective Rate Through Card Mix and Routing Optimization
Objective: Reduce the per-transaction cost of processing during peak periods by influencing card mix and optimizing transaction routing.
Your effective rate isn’t fixed. It’s influenced by the different card products and transaction types in your payment mix. Mastercard organizes interchange rates by product type and applies different qualification requirements to different transactions. That means changes in your card mix can change your effective processing cost even when your processor’s markup stays the same.
For B2B orders or high-ticket purchases, consider offering ACH as a payment option at checkout. Routing B2B orders from card networks to ACH can eliminate interchange entirely on those transactions. Even shifting 10-15% of your peak volume to lower-cost payment methods can meaningfully reduce your total fee exposure.
On the credit card side, ensure you’re on interchange-plus pricing rather than tiered or flat-rate pricing. Interchange-plus passes through the actual interchange cost with a fixed markup, which means you benefit from lower-cost card types rather than subsidizing higher-cost ones. If you’re not sure what pricing model you’re on, review these strategies for lowering credit card processing fees, including the switch to interchange-plus.
For businesses processing B2B transactions, submitting Level 2 and Level 3 data (purchase order numbers, tax amounts, line-item details) qualifies those transactions for lower interchange categories. If your processing statement shows B2B transactions downgrading to standard interchange, you’re overpaying on every one of those orders.
Anti-patterns: Don’t focus exclusively on negotiating your processor’s markup while ignoring interchange optimization. Don’t assume all card transactions cost the same. Don’t overlook ACH or debit incentives for high-ticket orders.
Success indicators: You know your card mix breakdown (credit vs. debit vs. ACH) and its trend during peak periods. You’re on interchange-plus pricing. You’ve identified at least one transaction category where you can shift volume to a lower-cost payment method.
Step 6: Stress-Test Your Cash Position Against the Forecast
Objective: Validate that your projected cash position can absorb the timing gap between fee deductions and deposit arrivals, even under adverse scenarios.
Take your daily forecast from Step 2 and run three scenarios: expected volume, 120% of expected volume (optimistic), and 80% of expected volume with a 3-day deposit delay (pessimistic). The pessimistic scenario simulates what happens if your processor slows funding during a risk review or bank holiday weekend.
For each scenario, map your daily cash position: starting balance, plus deposits received, minus processing fees, minus fulfillment costs (inventory, shipping, labor), minus ad spend. Identify any day where your projected cash position drops below your minimum operating threshold. Those are the days that break your peak season.
If your stress test reveals cash gaps, you have three levers: accelerate deposits (Step 3), reduce the gap between expense timing and revenue timing (negotiate supplier payment terms), or secure a working capital line before peak season when your financials look strongest. The worst time to seek credit is when you’re already in a cash crunch.
Anti-patterns: Don’t assume best-case scenarios. Don’t forget to include ad spend in your cash flow model (it’s often the largest variable expense during peak periods). Don’t wait until peak season to discover you need a credit line.
Success indicators: Your pessimistic scenario shows positive cash position throughout peak season, or you’ve identified and addressed the specific days where gaps exist. You have contingency funding in place before your first peak-season promotion launches.
Practical Examples: How This Plays Out
Scenario A: The Deposit Delay Trap
An eCommerce brand doing $1.2M annually runs a Black Friday promotion that generates $45,000 in sales Friday through Sunday. Their processor batches deposits on a T+2 schedule with no weekend processing. Friday’s $18,000 arrives Tuesday. Saturday’s $15,000 arrives Wednesday. Sunday’s $12,000 arrives Thursday. Meanwhile, they’ve already paid $6,000 in shipping costs Monday morning and committed $8,000 in ad spend for Cyber Monday. By Monday afternoon, they’re $14,000 short on operating cash, despite having $45,000 in sales on the books.
With next-day funding, Friday’s deposit arrives Saturday or Monday. The cash gap shrinks from $14,000 to roughly $3,000, easily covered by normal reserves.
Scenario B: The Surprise Reserve Hold
A growing DTC brand processed $150,000/month on average and was approved for $200,000/month. Their holiday campaign pushed November volume to $380,000. The processor’s risk system flagged the account and placed a 10% rolling reserve, freezing $38,000 over 30 days. The brand had to delay restocking and pause advertising for two weeks, costing them an estimated $60,000 in lost December sales. A single proactive call in September, with a volume forecast and supporting data, would have prevented the hold entirely.
Common Mistakes and Pitfalls
Treating peak season as a revenue event, not a cash flow event. Revenue is an accounting concept. Cash is what pays your suppliers. Until the deposit hits your account, a sale is a promise, not a resource.
Negotiating rates but ignoring funding speed. Saving 0.1% on your processing rate while losing 2-3 days of deposit access is a bad trade during peak season. The cost of delayed capital almost always exceeds marginal rate savings.
Assuming your processor will handle the spike smoothly. Processors are risk-management businesses first. If you surprise them with volume, they’ll protect themselves before they protect you. Proactive communication is not optional.
Optimizing in isolation. Your processing setup, funding speed, card mix, chargeback rate, and approved volume limit are interconnected. Fixing one without addressing the others creates new problems. The Forecast-Fund-Flatten framework works because it treats these as a system.
Waiting until after peak season to fix things. The best time to review your processing setup is 90 days before your peak period, when you have leverage and your processor has time to adjust. Understanding your true processing costs now gives you the data to negotiate from a position of clarity.
What to Do Next
Start with Step 1. Pull your last two peak-season processing statements and calculate your weekly effective rate. That single exercise will reveal whether your seasonal cost exposure is what you think it is. Most businesses discover it’s higher.
Then build your daily forecast for the upcoming peak period. Even a rough model that maps projected sales to deposit arrival dates will show you where the cash gaps live. That visibility alone changes how you plan.
This guide is designed as a reference you can revisit as your business grows and your volume patterns shift. Seasonal cost management isn’t a one-time project. It’s a recurring practice that gets more valuable as your peak-season revenue increases. Each cycle gives you better data, tighter forecasts, and more leverage to structure your processing setup around how your business actually operates.
Frequently Asked Questions
How can businesses use data to forecast transaction volume for seasonal planning?
Start with your historical processing statements, broken down by week (not month) during previous peak periods. Calculate your daily average transaction count and average ticket size for each week, then overlay your upcoming marketing calendar (promotions, product launches, ad spend increases) to project daily volume. The key is tying this forecast to your deposit schedule so you can see not just how much you’ll sell, but when the money arrives and what fees will be deducted before it does.
When should businesses review their payment processing setup before peak seasons?
At least 90 days before your peak period begins. This gives you time to request volume limit increases, negotiate funding speed changes, review your pricing model, and address any chargeback trends that could trigger risk flags. Waiting until 30 days out limits your options, and waiting until you’re already in peak season means you’re reacting to problems instead of preventing them.
What is a seasonal volume playbook in merchant services optimization?
A seasonal volume playbook is a documented plan that covers your projected transaction volume, approved processing limits, deposit schedule, card mix expectations, and contingency plans for cash flow gaps during peak periods. It connects your sales forecast to your processing infrastructure so that your payment setup supports your business goals rather than creating friction at the worst possible time.
Why do processors place holds or reserves during high-volume periods?
Processors use automated risk systems that flag accounts when transaction volume significantly exceeds approved limits. A sudden spike looks similar to fraud or business distress from a risk perspective. When flagged, processors may hold 5-10% of deposits in a rolling reserve or delay funding pending manual review. This protects the processor from chargebacks and fraud losses, but it can freeze significant capital for the merchant. Proactive communication and pre-approved volume increases prevent most holds.
How does card mix affect processing costs during peak season?
Credit cards carry higher interchange fees than debit cards or ACH transfers. During peak seasons, consumers tend to use credit cards more frequently (for rewards, higher purchase amounts, and buy-now-pay-later alternatives), which shifts your card mix toward more expensive transaction types. This can increase your effective processing rate by 0.1-0.3% even if your contracted rates haven’t changed. Monitoring card mix and offering lower-cost payment alternatives at checkout helps offset this shift.
Which strategies can help manage peak retail season processing costs effectively?
The most effective strategies address timing, not just rates: securing next-day funding to close deposit gaps, pre-approving higher volume limits to prevent reserve holds, shifting eligible transactions to lower-cost payment methods (debit, ACH), ensuring interchange-plus pricing so you benefit from lower-cost card types, and stress-testing your cash position against multiple volume scenarios before peak season begins. These structural changes compound in value as your peak-season volume grows.