Next-Day Funding: A Growth Guide for eCommerce
Last Updated on October 6, 2026 by Dimitri Akhrin
How 24-hour deposit cycles compound into inventory, ad spend, and operational headroom every month
Learn how delayed deposits quietly cap eCommerce growth and how next-day funding turns every sale into a reinvestment engine. This guide helps you quantify hidden costs and restructure cash flow management for compounding returns.
TL;DR
- Delayed deposits are a hidden growth cap — A business doing $10K/day with a 3 to 4 day deposit cycle has $30K to $40K in working capital trapped in transit at all times, unable to fund inventory, ads, or operations.
- Next-day funding is a reinvestment engine, not a convenience — Shortening your deposit cycle from 4 days to 1 day increases your monthly reinvestment cycles from roughly 8 to 30, creating a compounding growth effect.
- Start with an audit of real deposit timing — Measure actual hours from sale to bank availability, not your processor’s advertised terms. Most businesses discover their real timeline is 1 to 2 days slower than expected.
- Deploy freed capital strategically — Prioritize high-velocity returns like inventory restocking and scaling winning ad campaigns. Maintain a 10% to 15% buffer for chargebacks and unexpected costs.
- Protect your gains with chargeback prevention — Faster deposits accelerate your cash cycle, but unmanaged chargebacks reverse it. Proactive defense keeps your working capital intact and your reinvestment loop running.
Guide Orientation: What This Covers and Who It’s For
This guide examines how next-day funding works as a compounding growth lever for eCommerce businesses, not just a convenience feature. It’s built for eCommerce managers at established online businesses (typically 10 to 50 employees) who are doing meaningful daily volume but feel like their cash is always a step behind their ambitions.
By the end, you’ll understand exactly how delayed deposits cap your growth, how to quantify the hidden cost of slow settlement cycles, and how to restructure your cash flow management so that every sale feeds back into revenue-generating activity within 24 hours.
This guide does not cover payment gateway migration tutorials, PCI compliance checklists, or enterprise-scale treasury management. It focuses specifically on the operational and financial impact of deposit timing for growing eCommerce brands doing $5K to $50K per day in sales.
Why Next-Day Funding Matters More Than You Think

Revenue is not the same as available cash. Every additional day between a sale and its deposit leaves another day of revenue unavailable for inventory, advertising and operations.
Ecommerce is a cash-intensive business. You pay for inventory before it sells, you fund ad campaigns before they convert and you cover payroll before revenue clears. The gap between when you earn money and when you can spend it determines how aggressively you can grow.
Most processors settle funds in 2 to 5 business days. That sounds minor until you do the math. If your store processes $15,000 per day and your processor holds funds for three business days, you have $45,000 in limbo at any given moment. That’s $45,000 you can’t use to restock a bestseller, scale a campaign that’s printing money, or cover a surprise supplier invoice.
Cash flow pressure remains a significant challenge for growing businesses. In the Federal Reserve’s 2025 Small Business Credit Survey, 51% of employer firms cited uneven cash flows as a financial challenge and 56% cited paying operating expenses.
Delayed deposits don’t just create inconvenience. They create a structural ceiling on growth. When you can’t reinvest yesterday’s revenue into today’s operations, you’re financing your own business at zero interest to your processor. The cost of inaction isn’t dramatic. It’s quiet, persistent, and compounding.
Core Concepts: Understanding the Deposit-Growth Connection
Settlement Timing vs. Funding Speed
Settlement timing refers to the full cycle from transaction processing through settlement and ultimately to funds becoming available in your bank account. Funding speed is the portion your processor controls: how quickly they release your money after settlement. Many processors advertise “next-day” but mean next business day after a batch closes, which can mean 3 to 4 calendar days over weekends.
As the BAMS editorial team has noted, you should “track the actual elapsed time, not the ‘business days’ your processor quotes.” Real deposit behavior, measured in calendar hours, is the only metric that matters for cash flow planning.
The Reinvestment Cycle
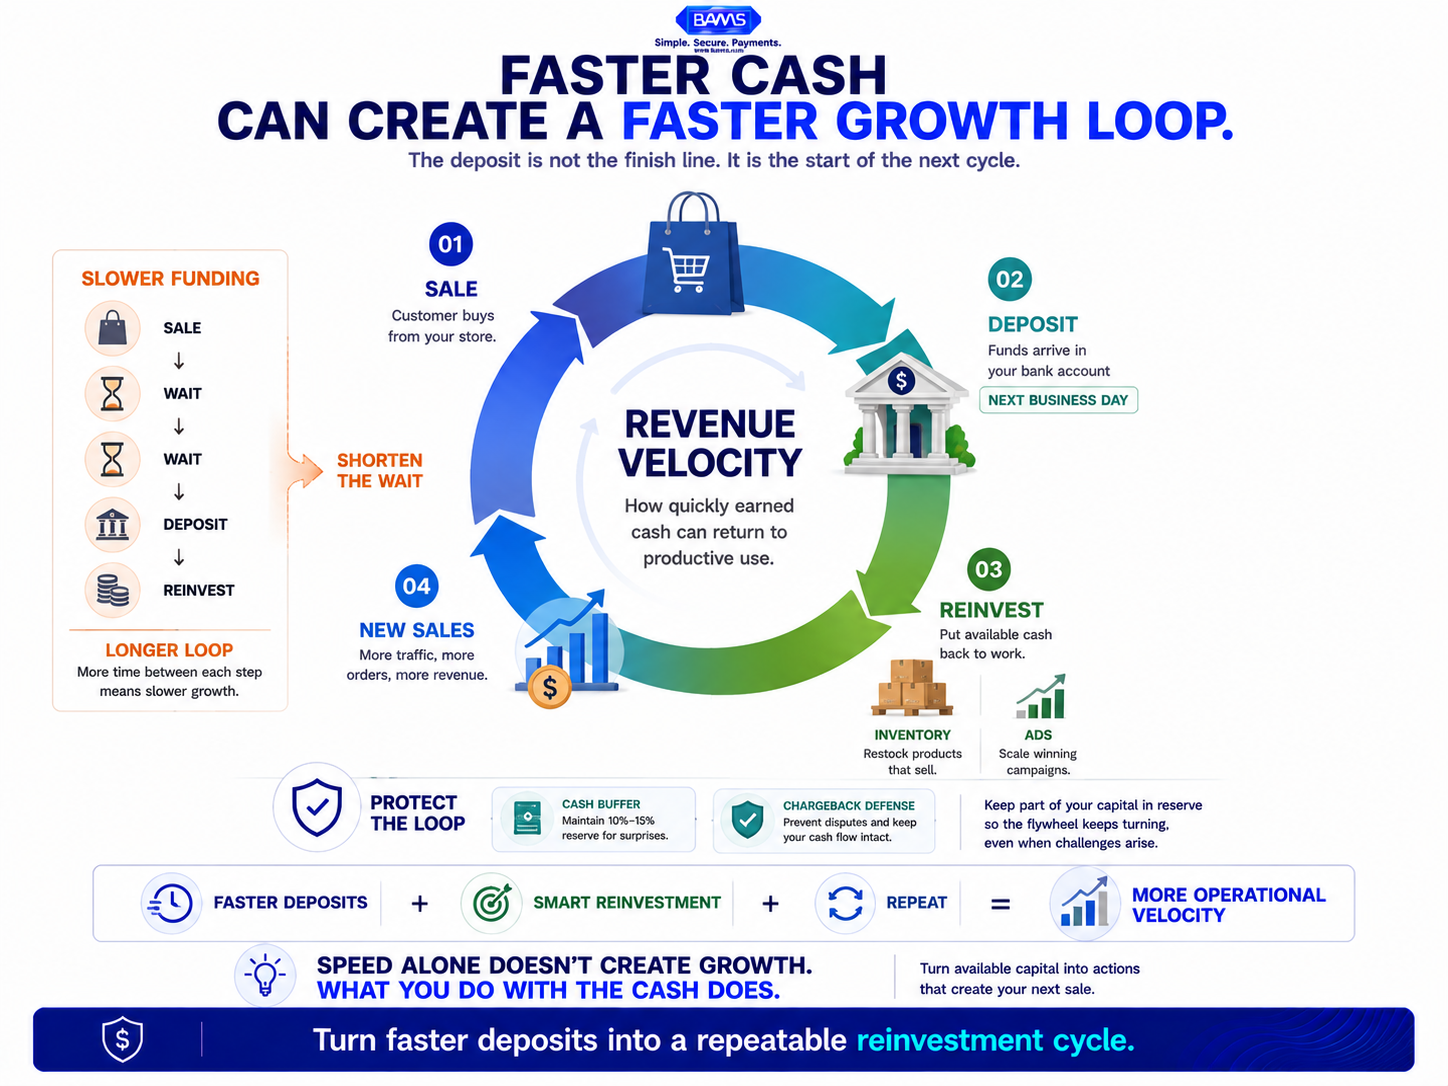
Every dollar your business earns enters a reinvestment cycle: sale → deposit → allocation → deployment → new sale. The speed of this cycle determines your effective growth rate. Shortening the deposit leg by even two days doesn’t just save time. It increases the number of reinvestment cycles you complete per month.
Think of it like compound interest. A business that reinvests revenue every 24 hours completes roughly 30 reinvestment cycles per month. A business waiting 4 days completes roughly 7 to 8. Same revenue, dramatically different velocity.
Faster funding creates an opportunity, not a return by itself. The growth effect comes from putting available cash back into productive uses that generate the next round of sales.
Working Capital vs. Available Capital
Working capital is what your balance sheet says you have. Available capital is what you can actually deploy right now. Slow deposits create a persistent gap between these two numbers. You’re technically profitable, but operationally constrained. This distinction is critical for eCommerce managers who feel cash-strapped despite strong top-line eCommerce revenue.
The Framework: Four Stages of Deposit-Driven Growth
Turning faster deposits into a growth lever follows a four-stage process. Each stage builds on the previous one, moving from visibility to optimization to compounding returns.
- Stage 1: Audit — Measure your actual deposit timing and quantify the capital trapped in transit.
- Stage 2: Accelerate — Shorten your settlement cycle through processor configuration, batch timing, and funding terms.
- Stage 3: Allocate — Build a systematic framework for deploying freed capital into high-return activities.
- Stage 4: Compound — Create feedback loops where faster deposits continuously fuel reinvestment and revenue growth.
These stages aren’t a one-time project. They form a recurring cycle you refine as your business scales. The guide below breaks each stage into actionable steps.
Step-by-Step: Building Your Deposit-Driven Growth Engine
Step 1: Audit Your Actual Deposit Timeline
Objective: Know exactly how long your money sits in transit, measured in real hours, not the estimate on your processor’s website.
Start by pulling your last 30 days of transactions and matching each batch to its corresponding bank deposit. Record the timestamp of the sale, the batch close time, and the moment funds appear in your account. Calculate the average elapsed time in hours, not business days.
Most eCommerce managers discover their actual deposit speed is 1 to 2 days slower than what their processor advertises. Weekend transactions, holiday holds, and batch timing quirks all extend the real timeline. A business processing $10,000 per day with a true 4-day deposit cycle has $20,000 to $40,000 in working capital trapped at any given time.
Document which days of the week produce the slowest deposits. Note whether your processor applies additional holds on certain transaction types (international orders, high-ticket items, new customer purchases). These patterns reveal where the biggest acceleration opportunities live.
Anti-patterns: Don’t rely on your processor’s dashboard alone. It often shows settlement dates, not actual bank availability dates. Don’t average across months without looking at weekly patterns, because weekend and holiday distortion hides the real picture.
Success indicators: You can state your average deposit time in hours with confidence. You know your worst-case deposit day. You’ve calculated the dollar amount sitting in transit on any given day.
Step 2: Accelerate Your Settlement Cycle
Objective: Reduce the gap between sale and spendable cash to 24 hours or less.
Three levers control your deposit speed: batch submission timing, processor funding terms, and bank processing windows. Optimize all three.
Batch timing: Most gateways auto-close batches at a default time (often midnight or end of business). If your bank processes ACH transfers in the morning, closing your batch at 10 PM instead of midnight can shave hours off your deposit. Test different batch close times and measure the impact on deposit arrival. For platform-specific guidance, this payment setup walkthrough covers the configuration details.
Processor funding terms: Not all processors offer true next-day funding. Some charge extra for it. Others offer it as a standard feature. If your current processor holds funds for 2 or more business days, this is the single highest-impact change you can make. BAMS, for example, offers next-day funding as a core feature for eCommerce merchants, which eliminates the multi-day float that quietly drains operational flexibility.
Bank processing: Your receiving bank matters too. Some banks credit ACH deposits faster than others. Confirm your bank’s cutoff times and availability schedules. Nacha notes that ACH payments may process within hours on the same banking day or be scheduled for the following banking day, while weekends and federal holidays can affect settlement availability.
Anti-patterns: Don’t assume “next-day” means the same thing across processors. Ask for the specific cutoff time and the actual calendar-day delivery window. Don’t overlook weekend and holiday gaps, which can turn “next-day” into “next-Tuesday.”
Success indicators: Your average deposit time drops below 28 hours. Weekend deposits arrive by Monday morning. You can predict deposit arrival within a 2-hour window on any given day.
Step 3: Quantify the Capital You’ve Unlocked
Objective: Translate faster deposits into a specific dollar figure you can allocate.
This step is where most businesses stop, and it’s exactly where the growth lever starts working. Once you’ve shortened your deposit cycle, calculate the freed capital using this formula: (Average Daily Revenue) × (Days Saved) = Newly Available Capital.
A business doing $12,000/day that moves from a 4-day to a 1-day deposit cycle frees up $36,000 in perpetual working capital. That’s not a one-time windfall. It’s money that’s now permanently available for deployment because the pipeline never backs up again.
Break this number into categories: How much could go toward inventory? Toward ad spend? Toward supplier early-payment discounts? Hidden costs from slow deposits include missed restock windows, forfeited supplier discounts, capped ad campaigns, inflated payroll reserves, and delayed competitive responses. Each of these represents a specific, quantifiable drag on your margins.
Build a simple spreadsheet that tracks your daily deposit amounts and maps them against your planned expenditures. This becomes your daily deposit forecast, a tool that turns abstract cash flow improvement into concrete allocation decisions.
Anti-patterns: Don’t treat freed capital as “extra money” to spend loosely. It’s recaptured working capital, and it needs a deployment plan. Don’t ignore the compounding effect. $36,000 reinvested into inventory that turns in 14 days generates far more than $36,000 in downstream revenue.
Success indicators: You have a specific dollar figure for freed capital. You’ve mapped that figure to 2 to 3 deployment categories. You update this calculation weekly as revenue fluctuates.
Step 4: Deploy Capital into High-Velocity Channels
Objective: Allocate freed capital to activities that generate the fastest, most measurable return.
Not all reinvestment opportunities are equal. Prioritize based on velocity (how quickly the investment converts back to revenue) and measurability (how clearly you can track ROI).
Inventory restocking: This is usually the highest-velocity use of freed capital. If your bestseller goes out of stock for 3 days while you wait for deposits to clear, you’re losing sales and organic search ranking. Faster deposits let you reorder before you stock out, not after. For ecommerce brands, over 50% of marketplace sellers cite delayed payouts as their top cash flow challenge, and stockouts are the most common downstream consequence.
Paid acquisition scaling: If a Facebook or Google campaign is producing a 3x ROAS, every day you can’t increase budget is a day of lost revenue. Freed capital lets you scale winning campaigns in real time instead of waiting for deposits to fund next week’s ad spend.
Supplier discounts: Many suppliers offer 2% to 5% discounts for early payment (net-10 vs. net-30 terms). On $50,000 in monthly inventory purchases, a 3% early-payment discount saves $1,500 per month, or $18,000 per year. That discount is only accessible if you have cash on hand when invoices arrive.
Anti-patterns: Don’t spread freed capital across too many initiatives at once. Pick the one or two channels with the clearest ROI and concentrate there. Don’t deploy 100% of freed capital. Maintain a buffer (typically 10% to 15%) for unexpected expenses or chargebacks.
Success indicators: You can trace a direct line from faster deposits to a specific revenue-generating activity. Your stockout frequency decreases. Your ad spend scales without requiring credit lines.
Step 5: Protect Revenue with Proactive Chargeback Defense
Objective: Prevent chargebacks from clawing back the capital you’ve worked to free up.
Faster deposits accelerate your cash cycle. Chargebacks reverse it. A single chargeback doesn’t just cost you the transaction amount. It costs you the product, the shipping, the processing fee, and a chargeback fee (typically $15 to $25). At scale, unmanaged chargebacks can erase the entire benefit of faster funding.
Proactive chargeback prevention starts before the dispute is filed. Clear billing descriptors, delivery confirmation, and responsive customer service resolve most issues before they escalate. For the disputes that do come through, having a dedicated team that manages evidence submission and representment is the difference between winning and losing.
BAMS provides proactive chargeback defense as part of its merchant services, which means disputes are flagged and managed before they become costly reversals. This is especially valuable for eCommerce brands where “item not received” and “not as described” disputes are common and often winnable with proper documentation.
Anti-patterns: Don’t ignore chargebacks until your ratio triggers a processor review. Don’t treat chargebacks as a cost of doing business without analyzing root causes. Don’t rely solely on automated tools without human review for complex disputes.
Success indicators: Your chargeback ratio stays below 0.5%. You win more than 40% of representments. You’ve identified and addressed the top 2 to 3 causes of disputes in your business.
Step 6: Build Feedback Loops That Compound
Objective: Create a self-reinforcing system where faster deposits continuously improve your operational capacity.
The real power of faster deposits isn’t the initial capital unlock. It’s what happens over 30, 60, and 90 days as reinvestment cycles compound. Here’s how to build the loop.
Weekly cash flow review: Every Monday, review the previous week’s deposits, deployment decisions, and returns. Did the inventory you restocked sell through? Did the ad spend you scaled maintain ROAS? Adjust allocation based on actual results, not projections.
Rolling 30-day forecast: Use your deposit data to build a rolling 30-day cash flow forecast that accounts for seasonal fluctuations, promotional periods, and inventory cycles. This forecast becomes your primary decision-making tool for capital allocation.
Reinvestment rate tracking: Measure what percentage of your daily deposits gets redeployed into revenue-generating activities within 48 hours. A healthy eCommerce operation should reinvest 60% to 75% of deposits, with the remainder covering fixed costs and reserves.
Over time, this system creates a flywheel: faster deposits fund faster restocking, which drives more sales, which generates more deposits, which fund more restocking. Each cycle is slightly larger than the last because you’re capturing revenue that previously leaked out through delays.
Anti-patterns: Don’t set and forget. The feedback loop only works if you actively review and adjust. Don’t optimize for speed alone. A fast deposit that funds a bad inventory decision is worse than a slow deposit that funds a good one.
Success indicators: Your reinvestment rate exceeds 60%. Your rolling forecast accuracy improves month over month. You can identify which reinvestment decisions generated the highest return.
Practical Example: The Compounding Effect in Action
Consider an eCommerce brand doing $15,000 per day in sales. Under a standard 3-day deposit cycle, this business has $45,000 trapped in transit at any given time. They frequently miss restock windows on their top 3 SKUs, costing them an estimated $3,000 per week in lost sales. Their ad team can’t scale winning campaigns mid-week because funds haven’t cleared.
After switching to next-day funding, $30,000 in working capital is freed immediately (the difference between 3 days and 1 day of float). Here’s how that capital gets deployed in month one:
- $15,000 to inventory: Top SKUs stay in stock continuously. Lost sales drop from $3,000/week to near zero, recovering $12,000 in monthly revenue.
- $10,000 to ad spend: The team scales a campaign producing 3.5x ROAS, generating $35,000 in additional monthly revenue.
- $5,000 held as buffer: Covers chargebacks, returns, and unexpected supplier costs without disrupting the reinvestment cycle.
By month three, the compounding effect is visible. Higher sales volume means larger daily deposits. Larger deposits mean more capital for reinvestment. The business is now doing $19,000 per day, and the gap between them and a competitor still waiting 3 to 4 days for deposits widens every week.
The key insight: the $30,000 in freed capital didn’t just save the business from inconvenience. It generated a measurable, compounding return that grew the top line by over 25% in a single quarter.
Common Mistakes and Pitfalls
Treating deposit speed as a back-office detail. Most eCommerce managers delegate payment processing to finance or ops and never revisit it. Deposit timing is a strategic lever, not an administrative checkbox. It deserves the same attention as your ad budget or inventory planning.
Confusing revenue with available cash. A strong sales month means nothing if the money is sitting in your processor’s account for four days. Cash flow management requires tracking when money arrives, not just when it’s earned.
Over-deploying freed capital. The excitement of unlocking working capital can lead to overcommitment. Always maintain a reserve. Chargebacks, returns, and seasonal dips will test your buffer.
Ignoring the processor relationship. Your payment processor is a financial partner, not a utility. Comparing gateways on speed, security, and fee transparency is essential. The cheapest processor isn’t always the best if their deposit timing costs you $30,000 in trapped capital.
Failing to measure the impact. If you can’t quantify how faster deposits affected your inventory availability, ad spend, or revenue, you can’t optimize the system. Track the numbers weekly.
What to Do Next
Start with the audit. Pull your last 30 days of transactions and calculate your real deposit timeline in hours. That single number will tell you whether deposit speed is a minor inefficiency or a major growth constraint in your business.
If the number surprises you (it usually does), run the freed-capital calculation: daily revenue multiplied by days you could save. That figure represents the permanent working capital you’re currently lending to your processor at zero interest.
From there, pick one deployment channel, likely inventory or ad spend, and model what that freed capital could generate over 90 days. The math tends to make the decision obvious.
This isn’t a one-time optimization. Revisit your deposit timing and reinvestment allocation quarterly as your revenue grows. What works at $10,000/day needs adjustment at $25,000/day. The framework stays the same. The numbers scale with you.
Frequently Asked Questions
How does next-day funding actually work for eCommerce businesses?
When you process a sale, your payment gateway authorizes the transaction and adds it to a batch. At batch close (usually end of day), your processor initiates settlement. With next-day funding, the processor releases funds to your bank account the following business day instead of holding them for 2 to 5 days. The key variable is your batch close time relative to your processor’s cutoff. Closing your batch before the cutoff (often early evening) ensures funds arrive the next morning.
What factors affect the speed of payment deposits for eCommerce businesses?
Four primary factors control deposit speed: your processor’s funding terms (next-day vs. standard 2 to 3 day), your batch submission timing, your receiving bank’s ACH processing schedule, and any risk-based holds your processor applies to certain transaction types. International transactions, high-ticket orders, and new merchant accounts are more likely to trigger additional holds. Optimizing all four factors together produces the fastest results.
How much working capital can faster deposits actually free up?
The formula is straightforward: multiply your average daily revenue by the number of days saved. A business processing $10,000 per day that moves from a 4-day to a 1-day deposit cycle frees up approximately $20,000 to $40,000 in working capital. This isn’t a one-time gain. It’s a permanent reduction in the amount of capital trapped in your settlement pipeline.
When should eCommerce merchants conduct a payment processing audit?
At minimum, audit your payment processing quarterly. Audit immediately if you notice deposits arriving later than expected, if your business volume has increased significantly (higher volume sometimes triggers new holds), or if you’re planning a major promotional period where cash flow timing is critical. The audit should measure actual deposit arrival times in hours, not rely on your processor’s stated terms.
How do chargebacks impact the benefits of faster deposits?
Chargebacks directly reverse the cash flow gains from faster deposits. Each chargeback pulls back the transaction amount plus fees, and high chargeback ratios can trigger processor reserves or holds that slow all your deposits. Proactive chargeback prevention (clear billing descriptors, delivery tracking, responsive customer service) is essential to protecting the working capital you’ve freed up through faster funding.
Is next-day funding worth it if my processor charges a premium for it?
Compare the premium against the cost of delayed capital. If next-day funding costs an extra 0.1% per transaction but frees up $30,000 in working capital that you reinvest at a 3x return, the math overwhelmingly favors faster funding. Many processors, including BAMS, include next-day funding as a standard feature without additional fees, making the decision even simpler.