
Bank Deposit Matching: A Step-by-Step Guide
Last Updated on September 28, 2026 by Dimitri Akhrin
Diagnose every gap between your eCommerce dashboard and your bank with a repeatable framework
Learn why your bank balance never matches your eCommerce dashboard and how to trace every dollar through the settlement timeline. This guide gives you a repeatable method for categorizing timing variances and turning deposit reconciliation into a predictable routine.
TL;DR
- Your dashboard and bank use different clocks — Dashboards record sales at authorization; banks show cash at posting. The gap between them is structural, not an error, and it follows predictable settlement timing patterns by card network (T+1 to T+3 for most cards, longer for Amex).
- Gross vs. net is a permanent gap, not a discrepancy — Your dashboard shows gross sales. Your bank receives net deposits after processing fees, refunds, and chargebacks are deducted. Build a gross-to-net bridge before investigating anything else.
- Most gaps are timing variances, not missing money — Weekends, holidays, and batch cutoff times cause predictable delays. Learn to categorize each gap as timing, fee deduction, refund/chargeback, or true exception before reacting.
- Map your settlement chain once, reference it forever — Document your gateway’s batch cutoff, each card network’s settlement window, and your bank’s ACH posting time. This single exercise explains the majority of discrepancies.
- Track patterns to build a baseline — After 2-4 weeks of consistent reconciliation, you’ll know what “normal” looks like for your business. Anything outside that baseline gets flagged; everything within it is noise you can safely ignore.
Guide Orientation: What This Covers and Who It’s For
This guide walks you through the exact reasons your bank balance doesn’t match your eCommerce dashboard, and gives you a repeatable method for diagnosing every type of gap. The focus is bank deposit matching for small-to-midsize online businesses, not enterprise-level multi-system reconciliation.
It’s written for eCommerce managers who process enough volume that a few thousand dollars in unexplained variance creates real operational stress. If you’ve ever stared at two numbers that should agree and wondered whether you lost money or just can’t find it, this is for you.
By the end, you’ll understand the settlement events that create timing variance, know how to categorize each type of gap, and have a framework for turning deposit reconciliation from a source of anxiety into a predictable part of your week. We won’t cover enterprise ERP integrations or multi-currency treasury management. We will cover the practical sequence of events between “customer pays” and “cash lands in your account.”

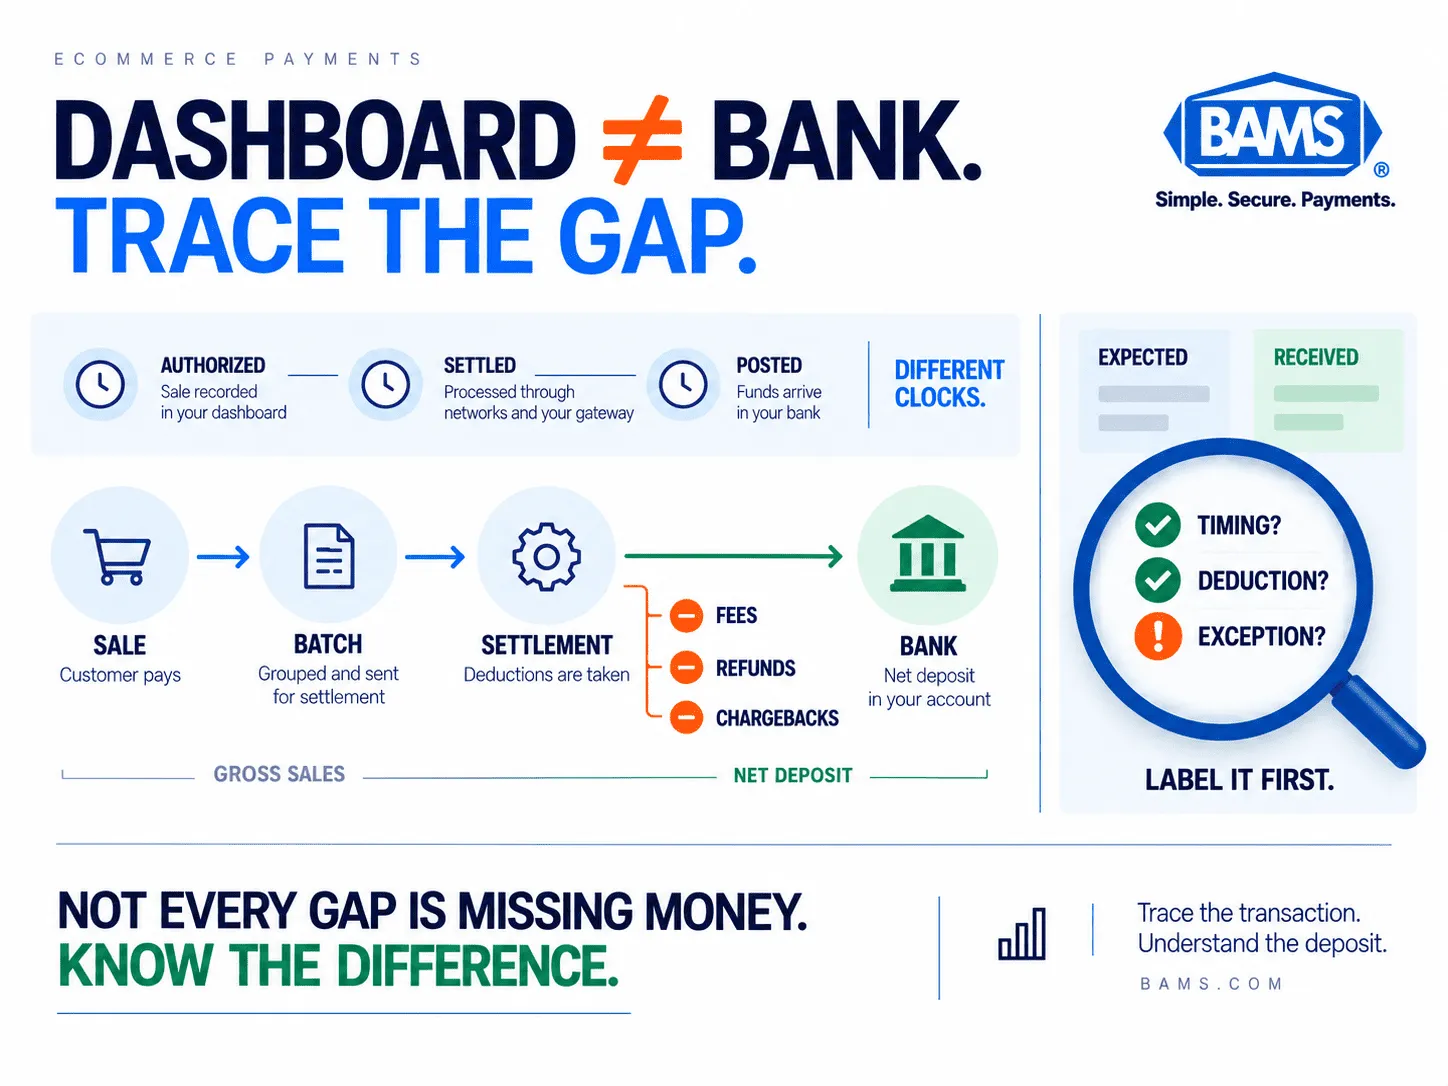
Your dashboard records sales before the bank records cash. Tracing the transaction through settlement, deductions and posting reveals whether the difference is normal or needs investigation.
Why Settlement Timing Variance Matters for Your Business
Your dashboard shows revenue. Your bank shows cash. These are not the same thing, and the gap between them is not a rounding error. It’s a structural feature of how payment processing works. Every card network, every payment gateway, and every bank operates on its own clock. When those clocks don’t sync, your numbers diverge.
The cost of misunderstanding this is concrete. When you can’t predict when deposits land, you can’t confidently commit to inventory purchases, ad spend, or payroll. You either hold excessive reserves (leaving growth capital idle) or overspend based on dashboard revenue that hasn’t actually arrived. Both outcomes erode margin.
The settlement chain itself explains why dashboard revenue and bank cash do not always move at the same time. The OCC defines merchant processing as the settlement of credit and debit card transactions and explains that the acquiring bank collects funds from the card-issuing bank before reimbursing the merchant. Settlement may also occur through ACH between the acquiring bank and the merchant’s bank. Those separate steps help explain why a transaction can appear in your eCommerce dashboard before the corresponding cash appears in your bank account.
This isn’t a back-office accounting task. It’s a strategic lever. When you can read the gap between your dashboard and your bank, you can plan cash flow with precision, spot genuine errors faster, and reinvest in growth without guessing.
Core Concepts: The Language of the Gap
Before diagnosing anything, you need to distinguish between three terms that most eCommerce operators use interchangeably but that mean very different things in the settlement process.
Authorization vs. Settlement vs. Posting
Authorization is the moment a customer’s card is approved. Your dashboard often records this as revenue immediately. But no money has moved. The card network has simply confirmed the funds are available and reserved them.
Settlement is when your payment processor submits the batch of authorized transactions to the card networks for actual fund transfer. This typically happens once per day, often at a cutoff time you may not know. Transactions authorized after the cutoff roll into the next day’s batch.
Posting is when your bank actually credits the funds to your account. This depends on your bank’s processing schedule, your merchant agreement, and whether the deposit arrives via ACH (which can take 1 to 3 business days after settlement).
Timing Variance vs. Real Exception
A timing variance is a gap that resolves itself within a predictable window. The money is in transit; it just hasn’t landed yet. A real exception is a gap that won’t resolve on its own: a chargeback, a processing error, an incorrect fee deduction, or a missing transaction. The single most important skill in deposit reconciliation is learning to tell these apart quickly.
Gross Sales vs. Net Deposits
Your dashboard typically shows gross sales. Your bank receives net deposits: gross sales minus payment processor fees, refunds, and chargebacks. This difference is permanent, not a timing issue. If you’re comparing gross to net, you’ll always see a gap, and it’s not an error.
The Diagnostic Framework: How to Read the Gap
The method for diagnosing dashboard-to-bank discrepancies follows a four-stage process. Think of it as a filter: each stage eliminates a category of variance so you can isolate what actually needs attention.
- Stage 1: Map the Clocks — Identify the specific timing rules for every system that touches your money.
- Stage 2: Reconcile in Layers — Compare gross-to-net, then net-to-deposit, then deposit-to-bank, in that order.
- Stage 3: Categorize Every Gap — Label each discrepancy as timing variance, fee deduction, refund/chargeback, or true exception.
- Stage 4: Build a Rolling Baseline — Track patterns over time so you can predict normal variance and flag anomalies instantly.
These stages are sequential the first time you run them. After that, stages 2 and 3 become your daily or weekly reconciliation routine, while stages 1 and 4 are periodic check-ins you revisit when something changes (new processor, new bank, new card network mix).
Deposit reconciliation becomes easier when every gap has a category. Map the timing, bridge gross sales to net deposits and investigate only the differences that fall outside your normal settlement pattern.
Step-by-Step Breakdown: Diagnosing the Gap
Step 1: Map Every Clock in Your Settlement Chain
Objective: Know the exact timing rules for every system that handles your money, so you can predict when funds should arrive rather than reacting when they don’t.
Start by documenting three things: your payment gateway’s batch cutoff time, your processor’s settlement schedule, and your bank’s posting schedule. Most ecommerce operators know none of these with precision. Your gateway likely batches transactions once daily, often at a fixed time (e.g., 9 PM ET). Any transaction authorized after that cutoff rolls into tomorrow’s batch, which means a sale at 9:15 PM on Tuesday won’t begin settlement until Wednesday.
Next, map the card-network-specific settlement windows. Visa and Mastercard typically settle in T+1 to T+2 business days, American Express can take 1 to 7 business days, and Discover runs T+2 to T+3. If your sales mix is 60% Visa/MC and 20% Amex, you should expect a portion of every day’s revenue to arrive later than the rest.
Finally, confirm your bank’s ACH posting schedule. Some banks post incoming ACH credits in the morning; others post in the afternoon. This single variable can make a deposit appear to arrive a full day late if your bank posts after you check.
Anti-patterns: Assuming all card networks settle on the same schedule. Ignoring weekend and holiday non-processing days (a Friday sale may not post until Tuesday or Wednesday). Relying on your dashboard’s “expected deposit date” without verifying it against actual bank behavior.
Success indicator: You can look at any transaction and predict, within one business day, when the funds should appear in your bank account.
Step 2: Build Your Gross-to-Net Bridge
Objective: Eliminate the permanent, non-timing differences between what your dashboard shows and what your bank receives, so you’re only investigating actual discrepancies.
Your dashboard reports gross sales. Your bank deposit reflects net revenue after deductions. The bridge between them includes payment processor fees, refund amounts, chargeback debits, and any other withholdings specified in your merchant agreement. Build a simple spreadsheet or use your processor’s reporting to calculate this bridge daily.
Start with your dashboard’s gross sales for a given day. Subtract the processing fees (typically a percentage plus per-transaction fee), subtract any refunds processed that day and subtract any chargebacks debited. The result is your expected net deposit. Compare this to the actual bank deposit for the corresponding settlement day (not the same calendar day, but the day the funds should post based on your clock map from Step 1).
This step catches a surprisingly common source of confusion: operators who see a $10,000 day on their dashboard and expect $10,000 in the bank, forgetting that 2.5% to 3.5% in processing fees means they should expect roughly $9,650 to $9,750. Over a month of high-volume sales, this adds up to thousands of dollars in “missing” money that was never missing at all.
Anti-patterns: Comparing gross dashboard numbers directly to net bank deposits. Forgetting that some processors deduct fees from each deposit while others bill fees separately at month-end (this changes your expected deposit amount significantly). Ignoring refund processing as a deduction category.
Success indicator: Your expected net deposit matches your actual bank deposit within a small, consistent tolerance (typically under $5 for daily reconciliation).
Step 3: Identify and Categorize Every Remaining Gap
Objective: For every discrepancy that survives the gross-to-net bridge, assign it a category so you know whether to wait, investigate, or escalate.
After building your bridge, you’ll have residual gaps. These fall into four categories:
- Timing variances: The money is in transit. Your clock map predicts when it will arrive. No action needed except tracking.
- Fee discrepancies: The processor deducted more or less than expected. This could be a rate change, a surcharge, or an error in your fee calculation. Compare against your merchant agreement terms.
- Chargeback and refund adjustments: A chargeback you didn’t expect, or a refund that posted on a different day than you initiated it. Cross-reference with your chargeback management system.
- True exceptions: A transaction that appears on your dashboard but never settles, or a deposit amount that doesn’t correspond to any known batch. These require investigation with your processor.
The key discipline here is labeling before acting.
Most operators see a gap and immediately assume something is wrong. In practice, most cash gaps are timing problems, not revenue problems. Modern Treasury’s reconciliation framework matches expected payments against bank transactions using defined rules and supports matching a single transaction to a batch of expected payments, including ACH or credit card settlements. Categorizing and matching first helps separate normal settlement behavior from exceptions that actually require investigation.
Reconciliation systems commonly use a 1 to 3 business day matching window for timing differences, with amount and counterparty as secondary match criteria when dates don’t align exactly. Adopt the same approach: don’t flag a timing variance as an exception until it exceeds your predicted settlement window by at least one business day.
Anti-patterns: Treating every gap as urgent. Failing to track chargebacks separately from timing variances (they require different responses). Not documenting your categorization, which makes it impossible to spot patterns later.
Success indicator: Every gap has a label, a predicted resolution date (for timing variances), or an assigned investigation action (for true exceptions).
Step 4: Account for Weekends, Holidays, and Month-End Boundaries
Objective: Understand why certain periods produce larger-than-normal gaps, and stop treating predictable calendar effects as emergencies.
Weekends and bank holidays are a major source of reconciliation timing differences. Nacha explains that ACH credits can settle the same day, the next banking day or up to two banking days later and that ACH payments are not currently settled on weekends or federal holidays. That means a merchant deposit moving through ACH can cross a weekend or holiday before it appears in the bank even when the underlying card transactions have already been processed.
This means your Monday or Tuesday bank balance often reflects a backlog of three to four days of transactions arriving simultaneously. Your dashboard, meanwhile, showed those sales in real time across Friday, Saturday, and Sunday. The visual gap between a flat bank balance over the weekend and a climbing dashboard creates the illusion that money is missing. It’s not. It’s queued.
Month-end boundaries create a related problem. A payment initiated in the final days of a month can settle in the first days of the next month. If you close your books on the last calendar day, some of that month’s revenue won’t appear in that month’s bank statements. This is normal, but it requires you to maintain a “pending deposits” ledger that carries over between months.
Anti-patterns: Panicking on Monday morning when the bank balance doesn’t reflect weekend sales. Closing monthly books without accounting for in-transit deposits. Scheduling large expenditures on Mondays without factoring in the weekend settlement delay.</p>
Success indicator: You can predict, before any weekend or holiday, exactly how many day
s of deposits will be delayed and when they’ll arrive.
Step 5: Track Patterns and Build Your Baseline
Objective: Move from reactive investigation to proactive prediction by establishing what “normal” looks like for your specific business.
After running this process for two to four weeks, you’ll start seeing patterns. Maybe your Amex deposits consistently arrive one day later than Visa. Maybe your processor’s batch cutoff means late-evening sales always show up two days later than morning sales. Maybe your bank posts ACH credits at 2 PM, so checking at 9 AM always shows yesterday’s deposit as missing.
Document these patterns in a simple reference sheet. Include: typical settlement lag by card network, typical bank posting time, typical fee deduction amount as a percentage, and typical weekend/holiday delay pattern. This becomes your baseline. Any deviation from it is worth investigating; anything within it is noise you can ignore.
This is also where you can evaluate whether your current processor’s settlement timing is costing you money. If your baseline shows consistent 2-3 day settlement delays, that’s 2-3 days of cash you can’t deploy. Settlement delays represent a measurable, compounding opportunity cost that most eCommerce businesses absorb as the default. Processors like BAMS offer next-day funding specifically to compress this window, which can meaningfully change your cash flow baseline if reinvestment speed matters to your growth model.
Anti-patterns: Not tracking patterns at all, which means you’re diagnosing from scratch every time. Setting your baseline too tight (expecting exact-penny matches daily) or too loose (accepting multi-day unexplained gaps as normal). Ignoring seasonal shifts in your card network mix that change your settlement timing profile.
Success indicator: You can open your bank statement and, within five minutes, confirm whether today’s balance is within expected range or requires investigation.
Step 6: Investigate True Exceptions With a Clear Escalation Path
Objective: Resolve the small number of genuine discrepancies quickly, with a documented trail that protects your business.
Once you’ve filtered out timing variances, fee deductions, and calendar effects, you’re left with true exceptions. These are rare if your process is working, but they require prompt attention. Common true exceptions include: a transaction that appears on your dashboard but never settles (possible authorization that was never captured), a deposit amount that doesn’t match any known batch (possible processor error), or a chargeback deducted without notification.
For each exception, gather three pieces of evidence before contacting your processor: the transaction ID from your dashboard, the expected settlement date from your clock map, and the actual bank statement showing the discrepancy. This documentation turns a vague “my numbers don’t match” call into a specific, resolvable inquiry. Most processors can trace a transaction within minutes if you provide the transaction ID and date.
If you’re finding true exceptions regularly (more than once or twice per month at moderate volume), that’s a signal worth investigating. It could indicate a payment gateway transparency problem where your dashboard isn’t surfacing the information you need. It could also indicate a processor-side issue that requires a conversation about your merchant agreement terms or reporting capabilities. BAMS, for example, pairs merchants with dedicated account managers who can investigate exceptions directly, which reduces resolution time compared to navigating a support queue.
Anti-patterns: Contacting your processor without specific transaction details. Letting exceptions accumulate for weeks before investigating (the older they are, the harder they are to resolve). Not maintaining a financial audit trail of resolved exceptions for future reference.
Success indicator: True exceptions are identified within 24 hours, documented with evidence, and resolved within one business week.
Practical Examples: Reading the Gap in Real Scenarios
Scenario 1: The Monday Morning Panic
Your dashboard shows $45,000 in sales from Friday through Sunday. Monday morning, your bank balance has increased by $0. You check again at 3 PM and see a single deposit of $14,200. Where’s the rest?
Diagnosis: Friday’s batch settled over the weekend but didn’t post until Monday afternoon (your bank posts ACH at 2 PM). Saturday and Sunday sales won’t batch until Monday evening at the earliest, settling Tuesday or Wednesday. The $14,200 represents Friday’s net deposit (gross sales minus fees and refunds). The remaining ~$30,000 will arrive across Tuesday and Wednesday, minus deductions. This is pure timing variance. No action needed except patience and your calendar.
Scenario 2: The Persistent $200 Gap
Every week, your total deposits come in roughly $200 less than your gross-to-net bridge predicts. The gap is consistent but unexplained.
Diagnosis: Check your merchant agreement for monthly or weekly fees that are deducted directly from deposits rather than billed separately. Common culprits include PCI compliance fees, statement fees, or gateway access fees. A $200/week gap could also be a batch of small chargebacks that your dashboard isn’t surfacing prominently. Pull your processor’s detailed fee statement and compare line by line against your agreement. This is a fee reconciliation issue, not a timing issue.
Scenario 3: The Month-End Mismatch
Your accountant reports that March revenue in the bank is $12,000 less than March revenue on your dashboard. April’s bank deposits, however, started unusually high.
Diagnosis: March 29, 30, and 31 fell on Thursday, Friday, and Saturday. Sales from those days settled the following week, posting April 1-3. The $12,000 is in-transit revenue that belongs to March operationally but landed in April’s bank statements. Maintain a pending deposits ledger to bridge this gap for accurate monthly revenue recognition.
Common Mistakes and Pitfalls
The most damaging mistake is treating every discrepancy as a crisis. When operators can’t explain a gap, they often assume fraud, processor error, or lost revenue. In reality, the vast majority of dashboard-to-bank discrepancies are timing variances that resolve within the normal settlement window. Reacting to timing as if it were theft wastes hours and creates unnecessary stress.
The second most common mistake is comparing the wrong numbers. Gross dashboard revenue will never match net bank deposits. If you haven’t built your gross-to-net bridge, you’re comparing apples to oranges every single day.
Third, many operators reconcile sporadically (monthly, or only when something feels wrong). Daily or weekly reconciliation is dramatically easier because each session covers a small number of transactions. Monthly reconciliation means untangling 30 days of overlapping settlement windows, which is where most people give up.
Finally, ignoring your merchant agreement is a quiet but expensive mistake. Fee structures, settlement schedules, and withholding terms are all specified in that document. If you haven’t read it recently, you may be working with outdated assumptions about when and how much money should arrive.
What to Do Next
Start with Step 1. This week, find your payment gateway’s batch cutoff time, your processor’s settlement schedule by card network, and your bank’s ACH posting time. Write them down. That single exercise will explain most of the gaps you’re currently seeing.
Then, pick one day’s transactions and walk them through the full gross-to-net bridge. See if the math works. If it does, you’ve confirmed your process. If it doesn’t, you’ve found your first real exception to investigate.
This guide is a reference, not a one-time read. Bookmark it. Return to the diagnostic framework when your settlement patterns shift (new processor, new bank, seasonal volume changes). Over time, you’ll develop an intuition for what’s normal and what’s not, and the gap between your dashboard and your bank will stop being a source of anxiety and start being a readable signal.
Frequently Asked Questions
What is deposit reconciliation in merchant services?
Deposit reconciliation is the process of matching the transactions shown on your payment dashboard to the actual deposits that appear in your bank account. It involves accounting for processing fees, refunds, chargebacks, and settlement timing delays to confirm that every dollar of revenue is accounted for. The goal is to verify that the net amount deposited matches what you expected based on your sales activity.
Why does my dashboard show more revenue than my bank balance?
Two reasons, usually working together. First, your dashboard shows gross sales (total transaction amounts), while your bank receives net deposits (gross minus processing fees, refunds, and chargebacks). Second, settlement timing means your dashboard records a sale the moment it’s authorized, but the cash may not post to your bank for 1 to 3 business days depending on the card network and your processor’s schedule. Both gaps are normal and predictable once you understand the mechanics.
How long do card settlements typically take?
Settlement timing varies by card network. Visa and Mastercard typically settle in T+1 to T+2 business days. American Express can take 1 to 7 business days. Discover generally runs T+2 to T+3 business days. ACH transactions can take 3 to 5 business days. Weekends and bank holidays add additional delays because settlements are not processed on non-business days.
When should I perform deposit reconciliation for my merchant account?
Daily or weekly reconciliation is far easier and more effective than monthly. Each session covers a smaller number of transactions, making discrepancies easier to spot and resolve. If daily feels like too much, a weekly cadence (matching the prior week’s dashboard activity to bank deposits) is a strong minimum. Monthly reconciliation is workable but significantly harder because you’re untangling 30 days of overlapping settlement windows.
What factors can affect the timing of merchant service deposits?
The main factors are: your payment gateway’s batch cutoff time (transactions after the cutoff roll to the next day), the card network’s settlement cycle (varies by brand), your bank’s ACH posting schedule (morning vs. afternoon), weekends and holidays (no processing on non-business days), and your merchant agreement terms (some agreements specify custom settlement schedules). Your sales mix across card networks also matters, since a higher proportion of Amex transactions will shift your average settlement time later.
How can I tell the difference between a timing variance and a real error?
A timing variance resolves itself within your predicted settlement window. If you’ve mapped the clocks in your settlement chain (gateway cutoff, processor schedule, bank posting time), you can predict when each transaction should post. If a discrepancy persists beyond that window by more than one business day, it’s likely a true exception that requires investigation. True exceptions include transactions that never settle, unexpected fee deductions, or chargebacks you weren’t notified about.


