Cash Flow Forecasting: Build Around Deposit Speed
A step-by-step tutorial for rebuilding your 30-day rolling forecast using daily funding cycles as the primary input
Learn how to build a cash flow forecast that uses deposit timing—not invoice volume—as its core input. This tutorial walks you through creating a 30-day rolling forecast that predicts available cash within 5% accuracy each morning.
TL;DR
- Deposit speed, not sales volume, is the real variable – Your eCommerce cash flow forecast breaks because you can’t predict when your processor releases funds, not because you can’t predict revenue.
- Build your forecast around deposit lag – Calculate your average settlement delay by day of week, then use that lag to map sales dates to actual deposit dates in a 30-day rolling spreadsheet.
- Next-day funding collapses the uncertainty – Switching from 3-5 day settlement to next-day deposits turns your inflow column from an estimate into a near-certainty, dramatically improving forecast accuracy.
- Reconcile daily, target 95% accuracy – Spend 10 minutes each morning comparing forecasted vs. actual balances. Track your 7-day rolling accuracy and recalibrate if it drops below 90%.
- Use the forecast to time spending decisions – Once accurate, tie inventory reorders and ad spend increases to forecasted cash availability rather than gut feeling or monthly budget cycles.
What You’ll Build: A Cash Flow Forecast That Actually Works With Daily Deposits
Most cash flow forecasting models assume you know when money arrives. But if your payment processor settles funds on a rolling, unpredictable schedule, your forecast is built on guesswork. This tutorial walks you through rebuilding your eCommerce cash flow forecast around daily funding cycles instead of invoice volume or monthly revenue projections.
By the end, you’ll have a working 30-day rolling forecast that uses deposit speed as its primary input. You’ll be able to predict your available cash within a narrow margin each morning, time inventory purchases to actual liquidity, and stop making spending decisions based on stale data.
Your success criteria: a forecast that stays within 5% accuracy of your actual ending cash balance over a rolling two-week window.
Prerequisites and Setup Checklist
Before you start, confirm you have the following in place. Missing any of these will create gaps in your forecast that compound over time.
- Spreadsheet tool (Google Sheets, Excel, or Airtable). This tutorial uses Google Sheets for formulas and examples.
- Access to your merchant account dashboard with deposit history for the last 90 days.
- Your payment processor’s documented funding timeline (same-day, next-day, or 2-5 business day settlement).
- A list of recurring fixed outflows: rent, payroll, subscriptions, loan payments with exact dates and amounts.
- Variable outflow estimates: ad spend, inventory reorders, shipping costs from the past 60 days.
- Bank account login with access to daily balance history.
Time estimate: 2-3 hours for initial setup. 10-15 minutes daily to maintain. Potential blocker: If your processor doesn’t provide granular deposit-level reporting, you’ll need to reconcile manually from bank statements.
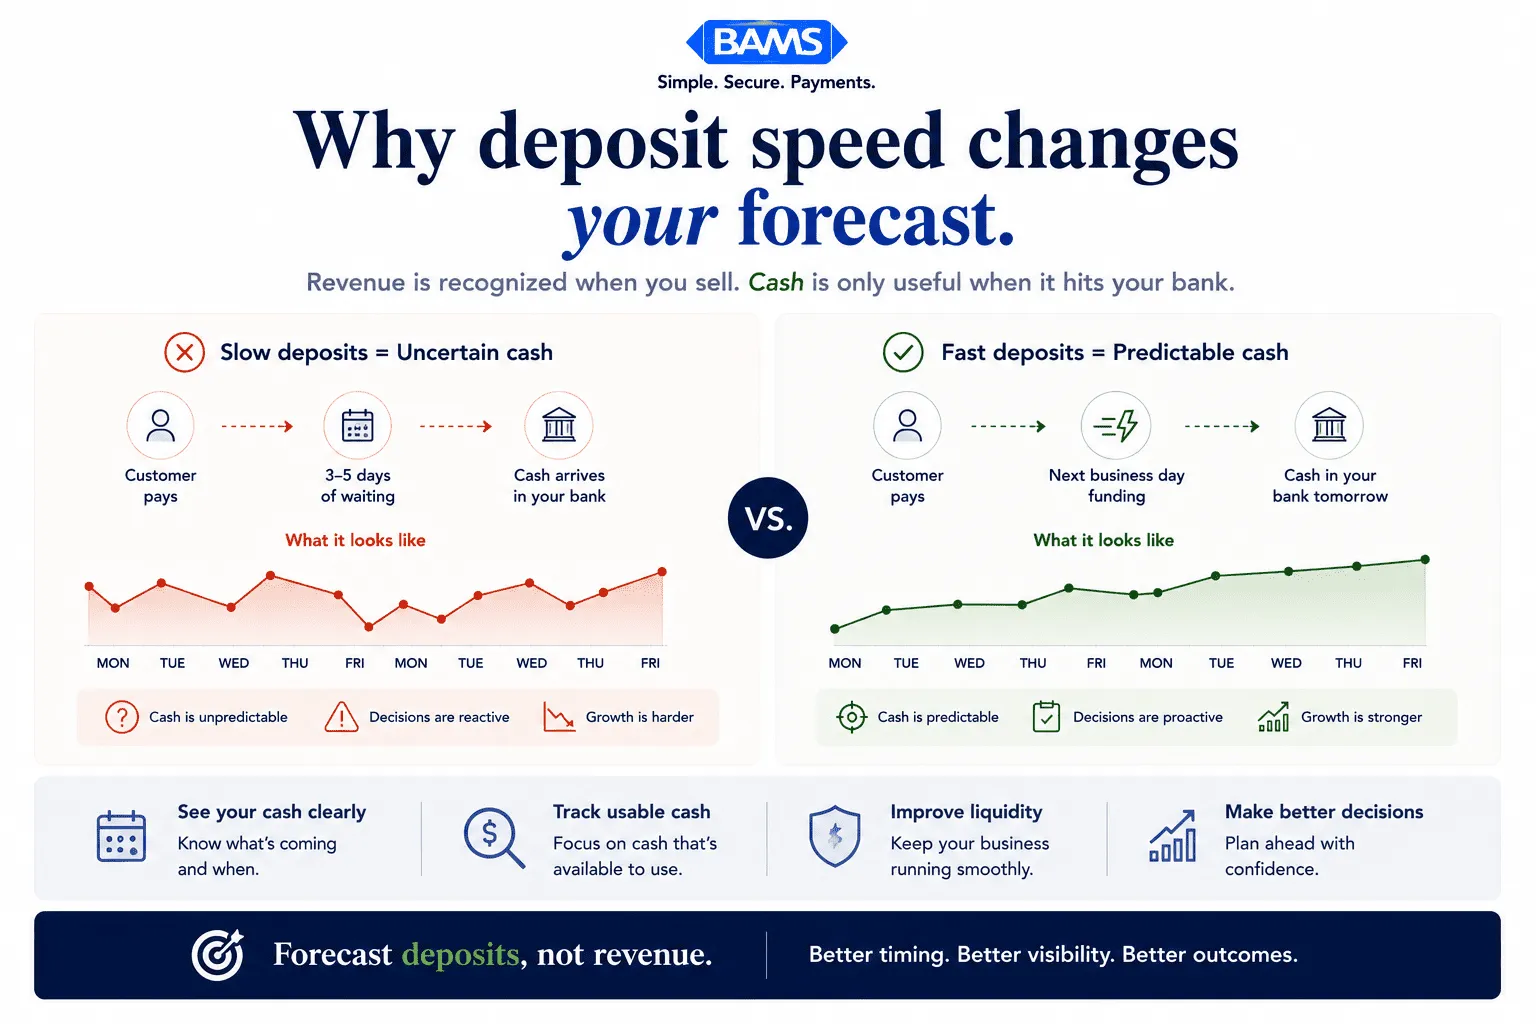
Why Deposit Speed Is Your Forecast’s Real Variable
Traditional cash flow forecasting treats revenue as the primary input: how much did you sell, and when will you collect? For eCommerce businesses processing card payments, collection isn’t the problem. You’ve already been paid at checkout. The real variable is when your processor releases those funds to your bank account.
A 3-5 day settlement window means Thursday’s sales might land Monday, Tuesday, or Wednesday of the following week. That ambiguity makes it nearly impossible to forecast daily available cash. Modern Treasury payment operations resources continue to emphasize that fragmented payment visibility and delayed settlement timing materially weaken forecast accuracy for growing businesses.
Switching to a daily funding model collapses that window. When deposits arrive predictably (same-day or next-day), your inflow timing becomes a near-constant instead of a variable. That single change transforms your forecast from a rough estimate into an operational tool.

For eCommerce businesses, the forecasting problem is rarely sales volume. It is deposit timing uncertainty.
Step-by-Step: Building Your Daily-Deposit Cash Flow Forecast
Step 1: Export and Analyze Your Deposit History
Action: Log into your merchant account dashboard and export your deposit history for the last 90 days as a CSV file. You need three columns at minimum: transaction date, deposit date, and deposit amount.
What to look for: Calculate the average lag between transaction date and deposit date. If you’re on a standard processor, you’ll likely see 2-5 business days. Note any patterns: do Friday transactions consistently land on Wednesday? Do deposits batch differently on weekends?
Expected result: A clear picture of your current “deposit lag” in days. This number is the gap your forecast currently can’t account for. Common failure: Some dashboards show “processed date” instead of “bank deposit date.” Always cross-reference with your actual bank statement to confirm when funds truly arrived.
Step 2: Map Your Current Deposit Lag Into a Timeline
Action: In a new Google Sheet, create a tab called “Deposit Lag Analysis.” Build a table with columns: Day of Week (Sale), Average Lag (Business Days), Typical Deposit Day, and Standard Deviation.
Use your 90-day export to populate this. Group transactions by the day of the week they occurred and calculate the average and standard deviation of the lag for each group.
| Sale Day | Avg Lag (Biz Days) | Typical Deposit Day | Std Dev |
|————|——————–|———————|———|
| Monday | 3.2 | Thursday | 0.8 |
| Tuesday | 3.1 | Friday | 0.7 |
| Wednesday | 3.4 | Monday | 1.1 |
| Thursday | 3.5 | Tuesday | 1.2 |
| Friday | 4.1 | Wednesday | 1.4 |
| Saturday | 4.3 | Wednesday | 1.3 |
| Sunday | 3.8 | Wednesday | 1.0 |
Checkpoint: If your standard deviation exceeds 1.5 on any day, your deposit timing is too volatile to forecast reliably with your current processor. That’s a signal to evaluate faster funding options. Common failure: Forgetting to exclude weekends and bank holidays from business-day calculations. Use the NETWORKDAYS function in Google Sheets.
Step 3: Build Your Inflow Forecast Using Deposit-Day Logic
Action: Create a new tab called “30-Day Forecast.” Set up columns: Date, Expected Deposits, Fixed Outflows, Variable Outflows, Net Cash Flow, Opening Balance, Closing Balance. Populate the Date column for the next 30 calendar days.
For the Expected Deposits column, do not enter your projected daily sales. Instead, enter the sales amount from the date that corresponds to your deposit lag. If your average lag is 3 business days, Monday’s “Expected Deposits” cell should reference the prior Wednesday’s actual (or projected) sales minus processing fees.
Expected Deposit (Today) = Sales (Today minus Deposit Lag) × (1 – Processing Fee Rate)
Example: If today is Thursday and your lag is 3 business days:
Expected Deposit = Monday’s Sales × (1 – 0.029)
Checkpoint: Your first 7-10 days of Expected Deposits should use actual sales data you already have. Days beyond that will use projected sales (covered in Step 5). Common failure: Forgetting to subtract processing fees. Your deposit is always net of fees, not gross sales.
Step 4: Layer in Fixed and Variable Outflows
Action: In the Fixed Outflows column, enter every known recurring payment on its exact date: payroll, rent, SaaS subscriptions, loan payments, insurance. These don’t change, so enter them as hard values.
For Variable Outflows, use your 60-day spending history to calculate daily averages by category (ad spend, inventory, shipping, supplies). Enter these as daily estimates. If you reorder inventory on specific days, enter those as lump sums on the expected dates instead.
Checkpoint: Sum your total outflows for the 30-day period and compare it to the previous month’s actual outflows. They should be within 10%. If they’re not, you’ve missed a category or underestimated a variable. Common failure: Omitting annual or quarterly payments (tax installments, insurance renewals) that fall within the forecast window.
Step 5: Project Forward Sales for Days Beyond Your Data Window
Action: For forecast days where you don’t yet have actual sales data, you need a projection. Use a simple trailing average: take the average daily sales from the past 14 days (same day of week) as your baseline.
Projected Sales (Next Monday) = Average of last 2 Mondays’ actual sales
For seasonal adjustment, multiply by a seasonal index if you track one:
Projected Sales = Trailing Avg × Seasonal Index for that week
Keep projections conservative. It’s better to forecast low and have surplus cash than to forecast high and miss a payment. Expected result: A complete 30-day row of Expected Deposits, blending actual data (near-term) with projections (further out).
Common failure: Using monthly averages instead of day-of-week averages. Ecommerce sales vary dramatically by weekday. Monday’s revenue profile rarely matches Saturday’s.
A reliable cash flow forecast starts by mapping sales into actual deposit timing, not projected revenue alone.
Step 6: Calculate Rolling Balances and Identify Cash Gaps
Action: Set your Opening Balance for Day 1 to your actual current bank balance (confirmed in your bank portal, not your accounting software). Then apply these formulas down the sheet:
Net Cash Flow = Expected Deposits – Fixed Outflows – Variable Outflows
Closing Balance = Opening Balance + Net Cash Flow
Opening Balance (Next Day) = Previous Day’s Closing Balance
Conditional-format any Closing Balance cell that drops below your minimum cash threshold (we recommend keeping at least 2 weeks of fixed outflows as a buffer) in red. These are your cash gap days.
Checkpoint: If you see red cells clustered around payroll dates or large inventory reorders, that’s your forecast working correctly. It’s showing you where deposit timing and outflow timing collide. Federal Reserve payment system resources continue to emphasize the importance of liquidity visibility, settlement timing accuracy, and operational cash management across modern payment environments.
Step 7: Compress the Lag by Switching to Next-Day Funding
Action: This is where the forecast model changes structurally. If you switch from a 3-5 day settlement window to next-day funding, your deposit lag drops to 1 business day. Update your Deposit Lag Analysis tab and recalculate your entire Expected Deposits column.
The impact is immediate: sales from Monday land Tuesday. Sales from Friday land Saturday or Monday (depending on your processor’s weekend policy). Your standard deviation on deposit timing should collapse to near zero.
For eCommerce businesses evaluating this shift, next-day funding from BAMS settles with a 9 PM EST cutoff, which means even late-evening transactions process for next-business-day deposit. This predictability turns your inflow column from an estimate into a near-certainty.
Expected result: Cash gap days shrink or disappear entirely, because deposits now arrive before (or on the same day as) many outflows they previously lagged behind.
Step 8: Automate Daily Reconciliation
Action: Each morning, spend 10 minutes on this routine. Log into your bank account and record the actual opening balance. Compare it to what your forecast predicted. Update the “Expected Deposits” cell for today with the actual deposit amount once it posts.
Track the variance in a separate column:
Variance = Actual Deposit – Forecasted Deposit
Variance % = Variance / Forecasted Deposit × 100
If your variance consistently exceeds ±5%, investigate. Common causes: refunds you didn’t forecast, chargebacks, or processing fee changes. Merchant Payments Coalition resources continue to highlight how payment friction and settlement inefficiencies create operational forecasting challenges for merchants.
Common failure: Skipping reconciliation on weekends or holidays, then entering bulk corrections that mask daily patterns.
Step 9: Add a 7-Day Rolling Accuracy Tracker
Action: Create a summary section at the top of your forecast tab that automatically calculates your 7-day rolling forecast accuracy:
==7-Day Accuracy = 1 – (ABS(SUM of 7-day Variances) / SUM of 7-day Forecasted Deposits) × 100
Target: 95% or higher. If you’re consistently below 90%, your sales projections or outflow estimates need recalibration. If you’re above 95% with next-day funding, your forecast is production-grade.
Checkpoint: Review this metric every Friday. If accuracy is declining week over week, check whether a new expense category has appeared, sales patterns have shifted, or a deposit anomaly (like a held batch) skewed the data.
Configuration and Customization
Your forecast should reflect your specific business rhythms. Here are the key variables to adjust:
- Deposit lag (days): Set to 1 for next-day funding, 2-5 for standard processors. This is the single most impactful variable in the model.
- Processing fee rate: Use your actual effective rate (total fees ÷ total volume), not the advertised rate. This typically ranges from 2.2% to 3.5% for eCommerce.
- Minimum cash threshold: Default to 14 days of fixed outflows. Adjust higher if you carry seasonal inventory or have volatile ad spend.
- Sales projection method: Trailing 14-day same-day average is the safe default. If you run promotions, override specific days with estimated promo revenue.
- Forecast horizon: 30 days is the recommended starting point. Federal Reserve Small Business Survey data continues to show that short-term liquidity visibility and operational forecasting remain top priorities for growing businesses, especially in volatile cash flow environments.
Must-change settings: Your opening balance (always use today’s real number) and your deposit lag (confirm with your processor, don’t assume).
Verification and Testing
Before relying on this forecast for spending decisions, run a parallel test for two weeks. Maintain your forecast daily while also tracking actual cash flow in a separate column. At the end of 14 days, compare:
- Was your closing balance prediction within 5% of actual on at least 10 of 14 days? If yes, your model is reliable.
- Did your cash gap warnings (red cells) correctly predict days where your balance dropped below threshold? Even one missed warning means your outflow estimates need work.
- Did any deposit arrive more than 1 day later than forecasted? If this happens repeatedly, your deposit lag assumption is wrong.
Edge cases to verify: end-of-month when multiple subscriptions and payroll hit simultaneously, days after a large promotional sale (high volume can sometimes delay batching), and bank holidays when deposits don’t process.
Common Errors and How to Fix Them
Error: Forecast shows cash surplus, but bank balance is lower than expected
Cause: You’re forecasting gross sales as deposits instead of net-of-fees deposits. Or you have pending refunds and chargebacks not reflected in outflows. Fix: Always multiply sales by (1 - effective fee rate) for deposits. Add a “Refunds/Chargebacks” outflow column using your trailing 30-day average refund rate.
Error: Deposits arrive but amounts don’t match forecasted values
Cause: Your processor batches transactions differently than you assumed. Some processors split deposits across multiple batches per day or combine weekend transactions into a single Monday deposit. Fix: Review your processor’s batching documentation. If batching is opaque, understanding why funding can take longer than expected will help you identify whether holds, risk reviews, or cutoff times are the issue.
Error: Forecast accuracy degrades after the first week
Cause: Your sales projections for days 8-30 are too rough. A flat daily average doesn’t capture weekly sales cycles. Fix: Switch to day-of-week trailing averages. If you run paid acquisition, factor in planned ad spend changes that will affect revenue.
Error: Opening balance doesn’t match previous day’s closing balance
Cause: A transaction posted that you didn’t forecast (bank fee, automatic payment, or unexpected deposit). Fix: Reconcile daily. Add a “Miscellaneous” row for unplanned items and track their frequency. If they’re recurring, they should become a named line item.
Error: Red cash-gap warnings appear but cash never actually runs out
Cause: Your minimum cash threshold is set too high, or your outflow estimates are inflated. Fix: Recalibrate your threshold after the 14-day test period using actual minimum balance data. Tighten variable outflow estimates using real spend, not budget.
Cash Flow Acceleration Strategies: Next Steps and Extensions
Once your daily-deposit forecast is running accurately, you can extend it in several directions:
- Tie inventory reorder triggers to forecasted cash availability. Instead of reordering on a fixed schedule, set reorder points that only activate when your forecast shows sufficient cash 3-5 days out. This is where cash flow acceleration strategies directly translate to inventory velocity.
- Build a scenario layer. Duplicate your forecast tab and model “best case” (10% above average sales) and “worst case” (20% below) scenarios. Use these to stress-test upcoming large purchases.
- Integrate with your accounting platform. If you use QuickBooks, Xero, or similar, explore API connections or Zapier automations that pull daily bank balances and deposit data directly into your sheet, reducing manual reconciliation to a quick review rather than data entry.
The goal is to reach a point where your cash position is never a surprise. NACHA ACH Network resources continue to emphasize how settlement timing, ACH workflows, and payment visibility directly affect liquidity forecasting and operational decision-making.
Frequently Asked Questions
What is a cash flow acceleration strategy?
A cash flow acceleration strategy is any operational change that gets earned revenue into your bank account faster. For eCommerce businesses, the most impactful lever is reducing your payment processor’s settlement window. Moving from a 3-5 day deposit cycle to next-day funding means you can reinvest revenue into inventory, advertising, and operations days sooner. Other tactics include automating invoice delivery for B2B orders and negotiating shorter payment terms with wholesale customers.
How can businesses improve cash flow forecasting with real-time data?
The most effective improvement is reducing the lag between when a transaction occurs and when the cash appears in your bank account. When deposits arrive next-day, your forecast’s inflow column shifts from an estimate to a near-confirmed number. Pair that with daily reconciliation (comparing forecasted vs. actual balances each morning) and you’ll maintain accuracy above 95% over rolling two-week windows. Around 47% of finance leaders cite improving cash forecasting as a top priority, and faster deposit data is the simplest path to better accuracy.
Why does deposit timing matter more than sales volume for eCommerce cash flow?
Because eCommerce businesses collect payment at checkout, revenue recognition isn’t the bottleneck. The bottleneck is when your processor releases those funds. A business doing $10,000 per day with a 4-day settlement lag has $40,000 perpetually “in transit.” The same business with next-day funding has only $10,000 in transit. That $30,000 difference is real working capital you can deploy for inventory, ads, or supplier discounts.
How often should I update my cash flow forecast?
Daily. A cash flow forecast for an eCommerce business operating on daily funding cycles should be reconciled every morning. This takes 10-15 minutes: confirm your opening bank balance, update yesterday’s actual deposit, and review today’s expected outflows. Weekly or monthly updates are insufficient because even a one-day delay in a large inflow or outflow can distort your short-term liquidity picture.
Which payment solutions can help reduce processing fees?
Look for processors that offer interchange-plus pricing (where you see the actual card network cost plus a transparent markup) rather than tiered or flat-rate models. Transparent pricing lets you forecast processing fees accurately because you can calculate your effective rate from real data. Also evaluate whether your processor charges separately for next-day funding or includes it as a standard feature, since an add-on fee for faster deposits can offset some of the cash flow benefit.
Can I use this forecasting method if my processor has a 3-5 day settlement window?
Yes, but your accuracy will be lower. The model still works; you just need to account for higher standard deviation in your deposit timing. Use the deposit lag analysis from Step 2 to build day-of-week-specific lag estimates. However, if your standard deviation consistently exceeds 1.5 business days, your forecast will have blind spots that no amount of spreadsheet work can fix. At that point, switching to a faster funding provider is the structural solution.

