How reserve holds, batch delays, and processor risk flags quietly break your deposit schedule Learn how chargeback activity disrupts your cash flow calendar long before disputes appear on a bank statement. This guide reveals the hidden cost of delayed deposits, from reserve increases to lost next-day funding eligibility. TL;DR Chargebacks cost more than the lost […]
Category: Level 3 Processing Optimization

Featured Article
7 Ways Chargebacks Erode Your Funding Timeline
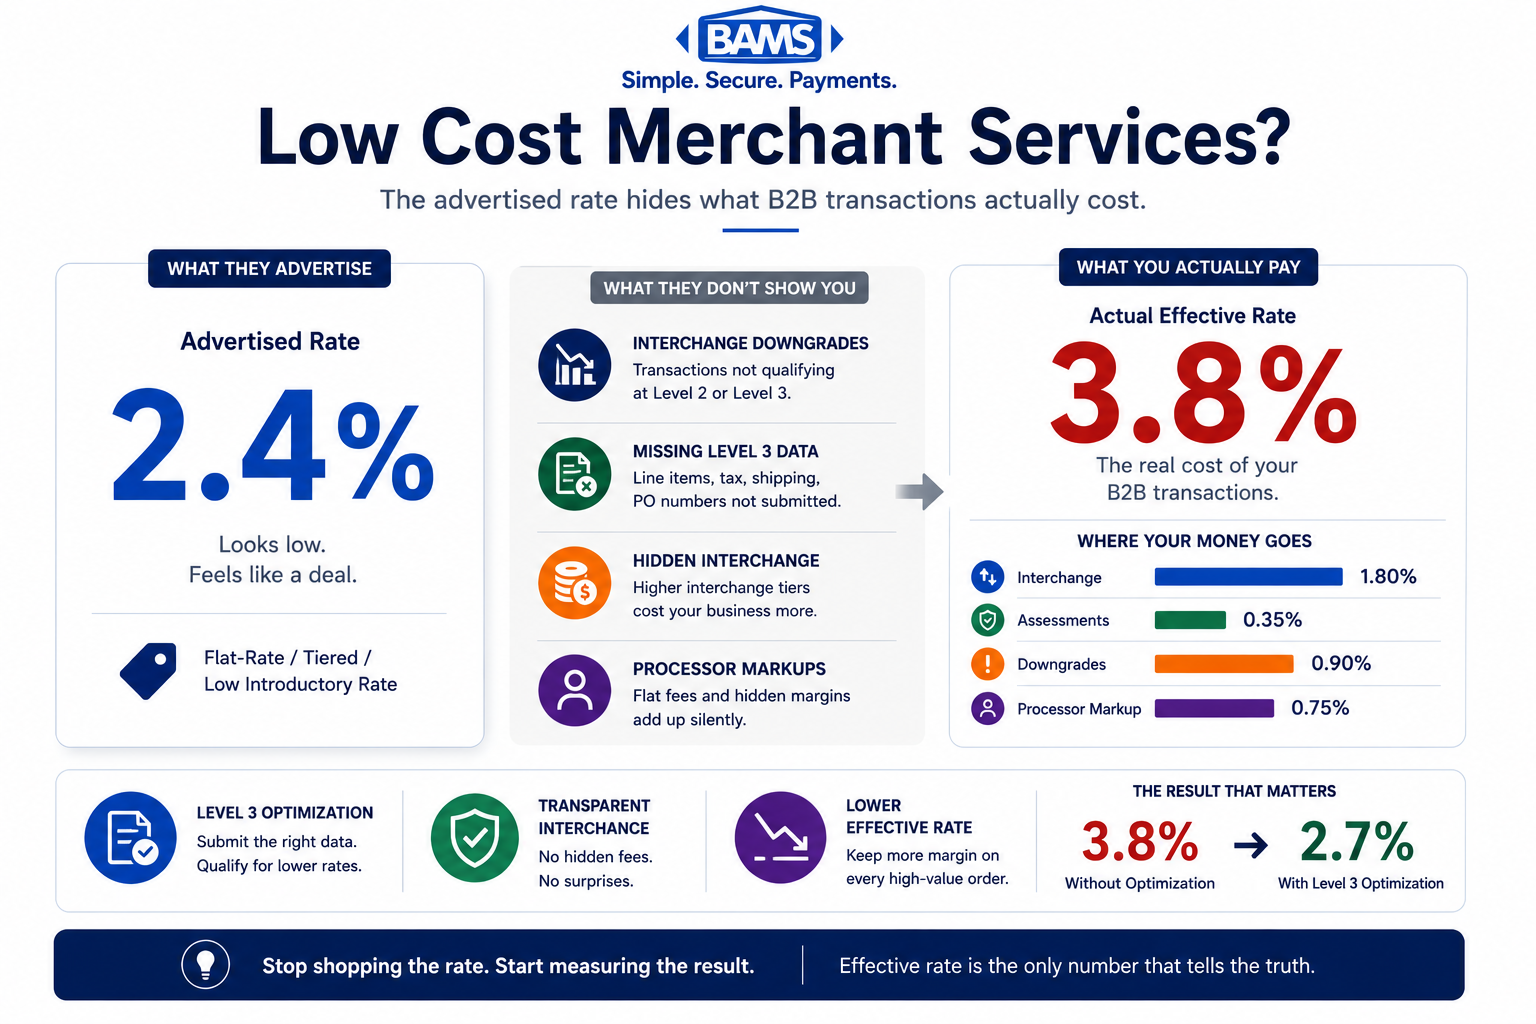
The advertised rate hides what B2B transactions actually cost — effective rate is the only number that matters Learn why ‘low cost’ merchant services often cost more on B2B and high-ticket orders. Discover how effective processing rate exposes hidden costs that advertised rates obscure, and why Level 2/3 optimization is the real benchmark. TL;DR Advertised […]
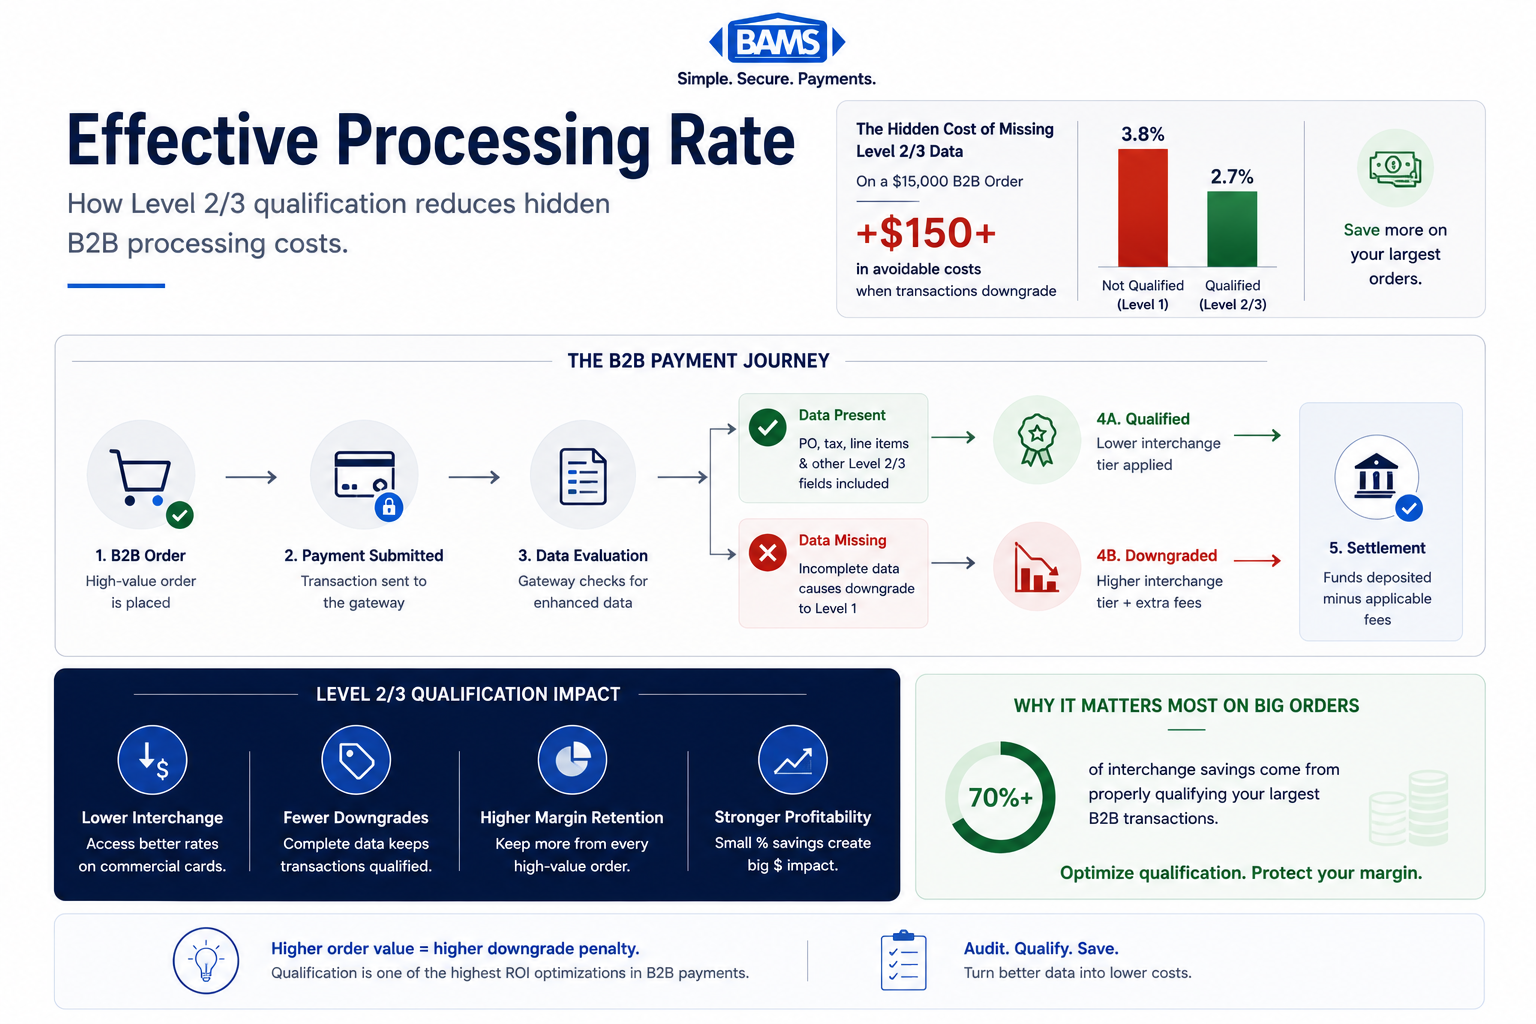
How missed Level 2/3 qualification silently inflates costs on your highest-value B2B orders Learn how interchange qualification failures drive up your effective processing rate on large B2B orders. This guide walks you through auditing your processor’s Level 2/3 data handling and reclaiming margin where it matters most. TL;DR Your largest B2B orders cost the most […]
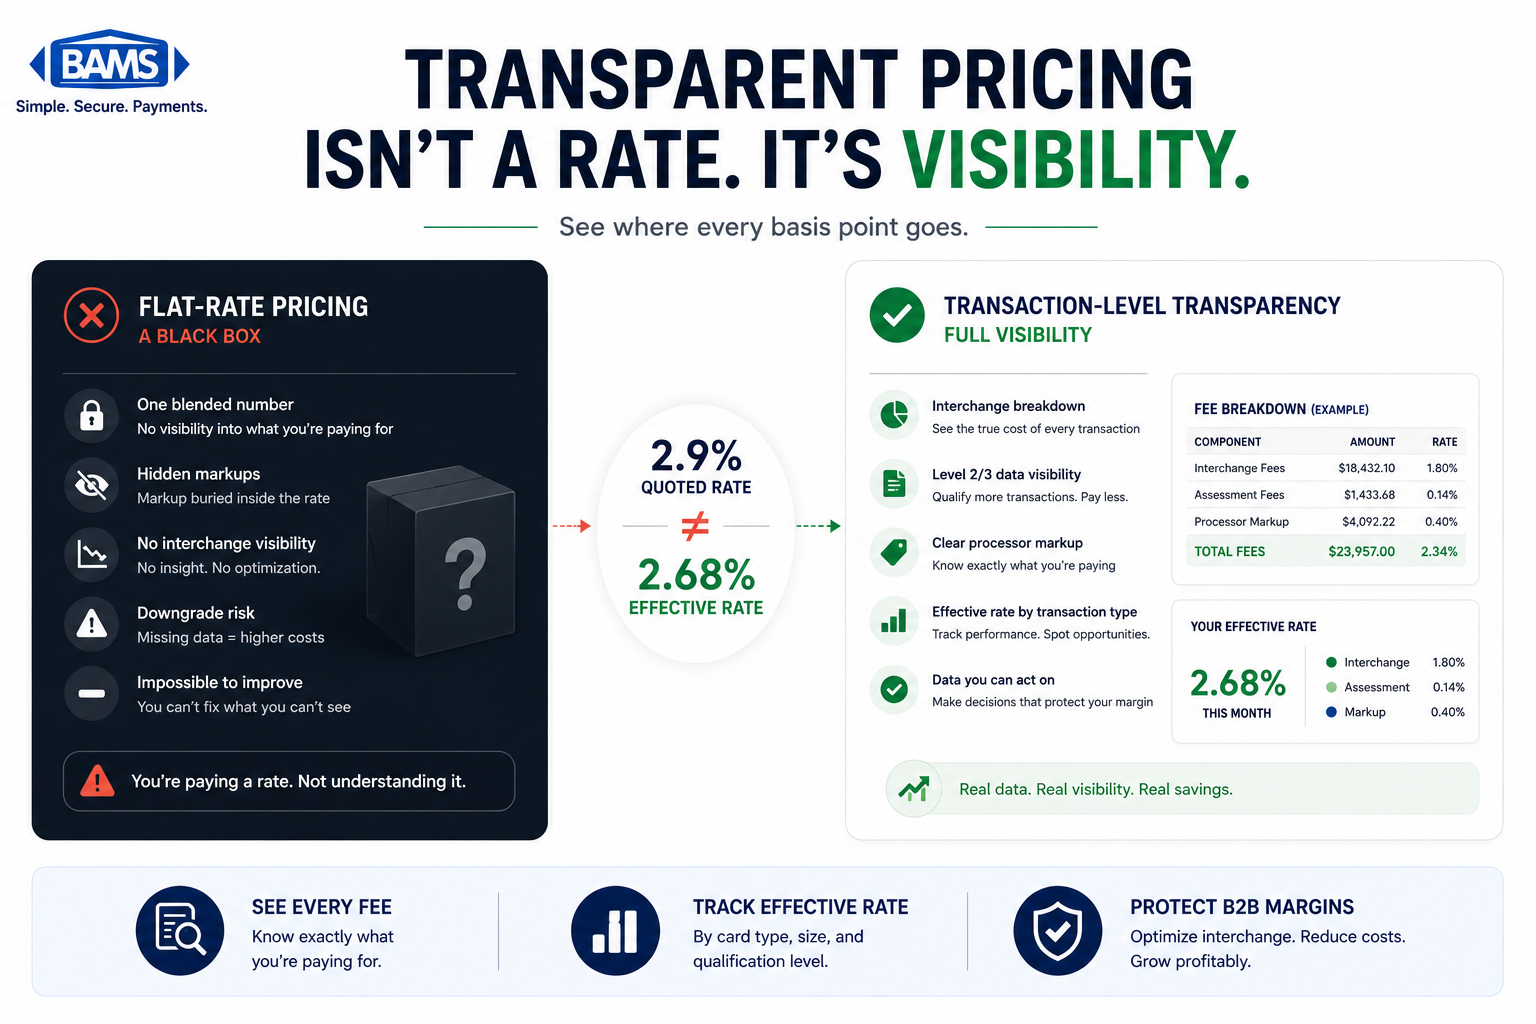
Why a single quoted rate tells you nothing about where your processing margin actually goes Learn why flat-rate pricing marketed as transparent actually obscures your true costs. Discover how to evaluate merchant service charges at the transaction level and what mid-market eCommerce businesses should demand from a processor. TL;DR Flat-rate pricing isn’t transparent – It […]
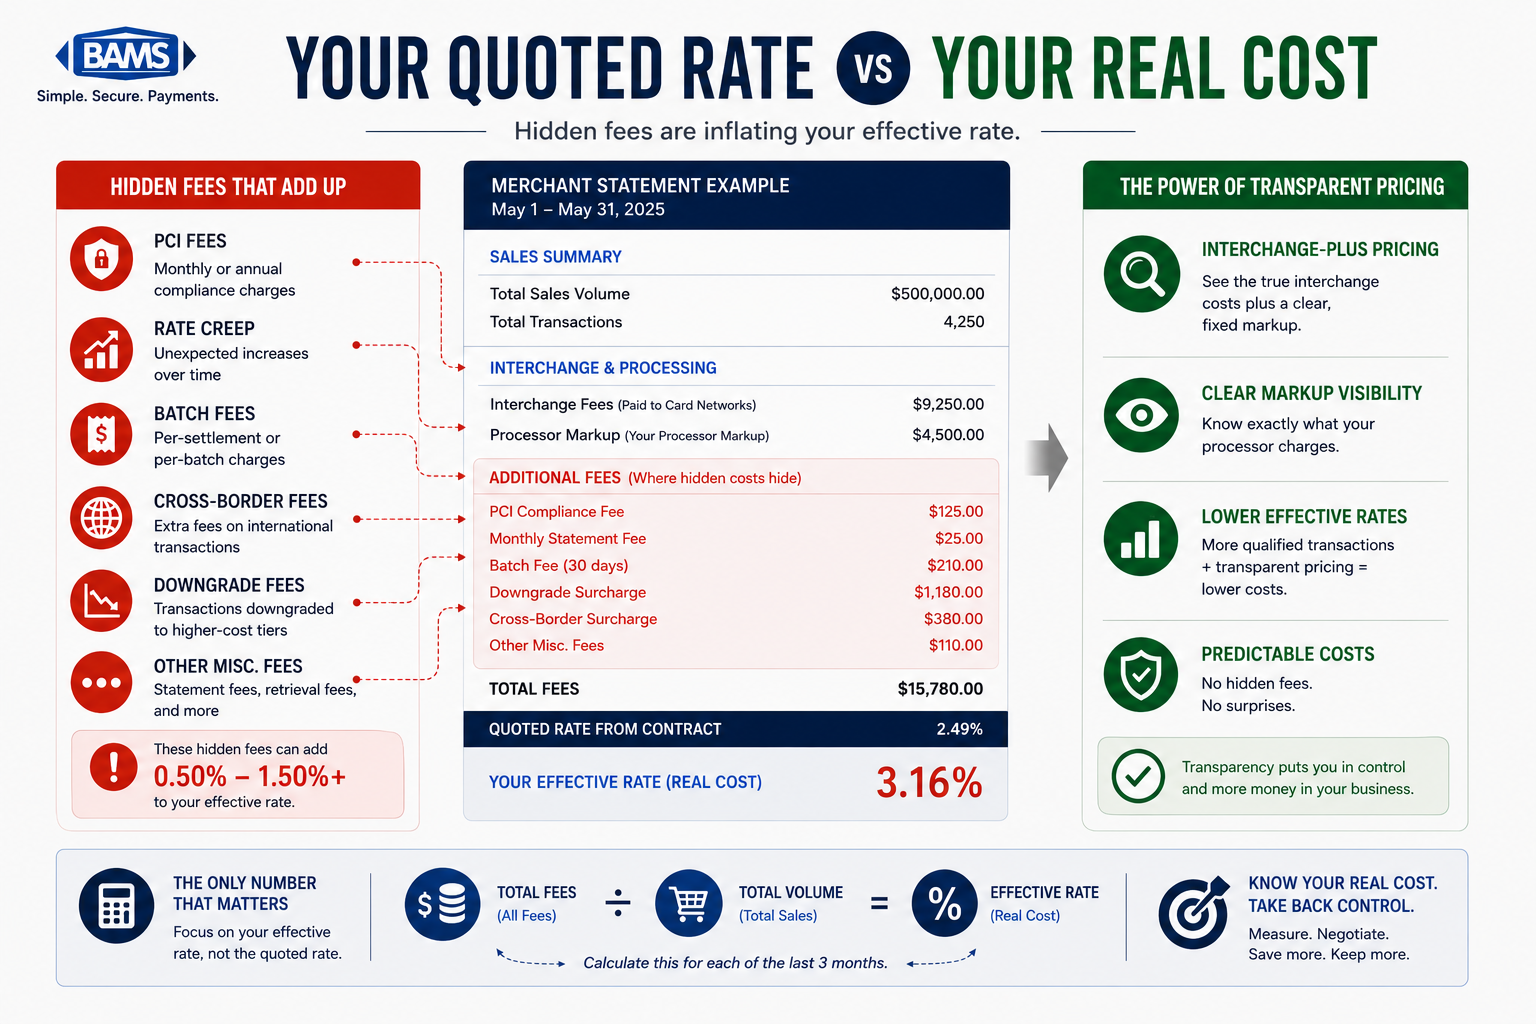
Calculate your real B2B processing cost in under an hour using only your existing statements Learn to audit your merchant statements line by line, calculate your true effective processing rate, and identify every buried markup inflating your B2B costs. No new software or contracts required — just your last three statements and 60 minutes. TL;DR […]
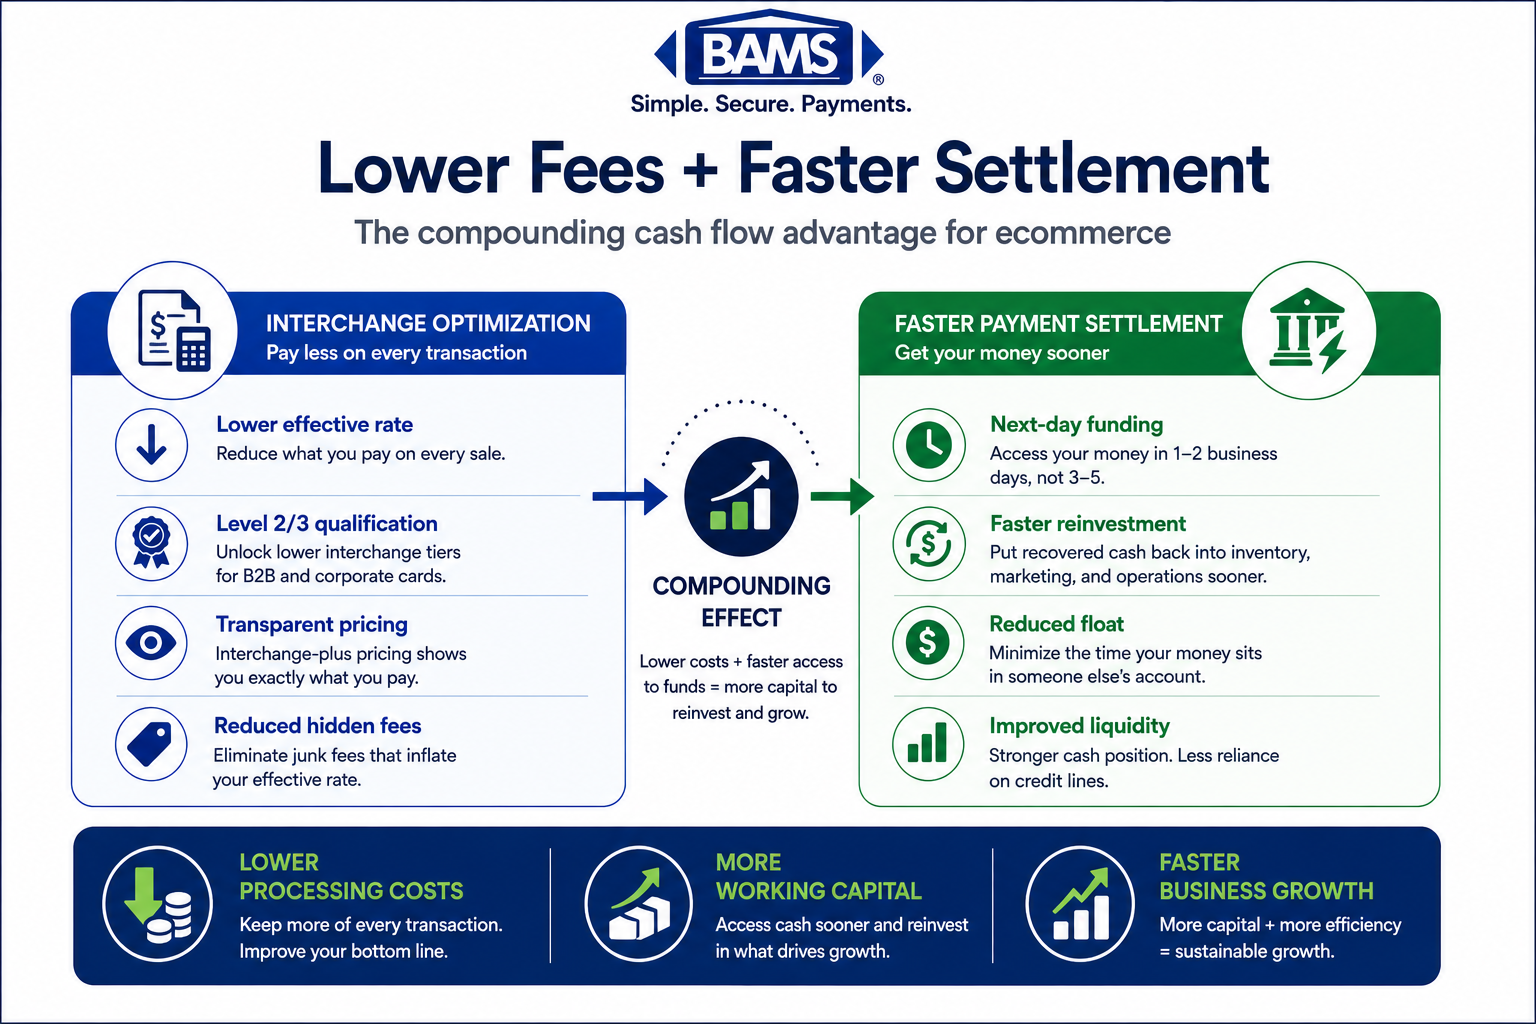
How connecting interchange optimization with settlement speed creates a compounding cash flow advantage for eCommerce Learn how to audit your processing setup, qualify for lower interchange tiers, and link those transaction cost savings to faster payment settlement. This guide shows mid-market eCommerce operators how the combined effect drives reinvestable cash flow. TL;DR Your effective processing […]
