
Chargeback Ratio Management: A Cash Flow Guide
Last Updated on October 1, 2026 by Dimitri Akhrin
How uncontested disputes quietly raise your reserve thresholds and lock up working capital as you scale
Learn how your chargeback ratio directly controls processor reserve requirements and why those holds tighten during growth phases. This guide shows you how to forecast around held funds, negotiate lower reserves, and turn dispute management into a cash flow lever.
TL;DR
- Reserves are risk pricing, not fixed penalties — Your processor sets reserve requirements based on your chargeback ratio and risk profile. Improve those inputs, and you can negotiate lower holds that free up significant working capital.
- Chargebacks compound beyond the transaction loss — U.S. merchants lose $4.61 for every $1 in chargebacks when you factor in fees, operational costs, and the reserve capital that gets locked away. The reserve impact alone can trap hundreds of thousands of dollars during growth phases.
- Prevention beats representment for ratio control — Nearly 79% of disputes are friendly fraud. Billing descriptor fixes, pre-dispute alerts, and accessible refund processes prevent more chargebacks than fraud filters or representment combined.
- Negotiate proactively with data — Don’t wait for your processor to offer better terms. Build a review package showing your improved ratio, prevention measures, and representment track record, then request specific reserve reductions.
- Forecast around reserves during growth — Build reserve holds into your cash flow model so seasonal spikes and volume growth don’t create unexpected liquidity gaps. The businesses that scale smoothly plan for the cash timing mismatch reserves create.
Guide Orientation: What This Covers and Who It’s For
This guide explains how chargeback ratio management directly controls the reserve requirements your payment processor imposes, and how reducing those reserves unlocks real merchant cash flow improvements as your business scales. It’s written for eCommerce managers at established online businesses who are growing steadily, processing significant volume, and discovering that reserves are quietly consuming working capital they assumed was available.
By the end, you’ll understand exactly how processors calculate reserve thresholds, why those thresholds tighten during growth phases, and what specific steps you can take to negotiate lower holds over time. You’ll also learn how to forecast around held funds so reserves stop being a surprise line item in your cash flow planning.
This guide does not cover high-risk merchant categories (adult, CBD, gambling) or initial account approval. It focuses on mainstream eCommerce businesses that have clean histories but are hitting reserve friction as they scale.
Why Chargeback Ratio Management Is a Cash Flow Lever, Not Just a Compliance Metric
Most eCommerce operators treat chargebacks as isolated transaction losses. A customer disputes $85, you lose $85 plus a fee, and you move on. That framing misses the compounding effect. Every uncontested chargeback does two things simultaneously: it takes revenue you’ve already earned, and it nudges your dispute ratio upward, which signals to your processor that your account carries more risk.
Processors respond to that signal by holding more of your money. Some processors require reserves of 5–20% of settlement when chargeback ratios become elevated. For a business processing $500,000 per month, a 10% reserve means $50,000 sitting in a hold account instead of funding inventory, payroll, or marketing. That’s not a fee. That’s a cash flow constraint that compounds with every month of growth.
Chargebacks create costs that extend beyond the disputed transaction itself, including operational expenses, lost merchandise, dispute administration, and increased processing risk. During growth phases, when you need capital most aggressively, this dynamic creates a paradox: the more you sell, the more cash gets trapped if your dispute ratio isn’t actively managed.
The businesses that scale smoothly aren’t the ones with zero chargebacks. They’re the ones that treat dispute ratio as a controllable input to their financial exposure, not a number they check quarterly.
Core Concepts: Reserves, Ratios, and the Risk Feedback Loop
What Reserves Actually Are
A reserve is a percentage of your processed volume that your payment processor withholds as a buffer against future chargebacks, refunds, or fraud losses. There are three common types: upfront reserves (a lump sum held at account opening), rolling reserves (a percentage of each settlement held for a fixed period, typically 90–180 days), and capped reserves (funds held until a target balance is reached). Rolling reserves are the most common for growing eCommerce businesses.
The Chargeback Ratio
Your chargeback ratio is the number of disputes divided by the number of transactions in a given period. Visa maintains merchant monitoring programs that evaluate excessive chargeback activity, making chargeback ratio an important metric for merchants to monitor as part of their payment operations. Crossing the 1% threshold can trigger monitoring programs, higher fees, or forced migration to high-risk processing relationships. But the reserve impact often kicks in well before you hit those thresholds. Visa provides merchants with guidance on chargeback management, monitoring programs, and best practices for reducing disputes through improved payment acceptance and operational processes. See Visa’s merchant chargeback resources.
The Risk Feedback Loop
Here’s the dynamic most content ignores: reserves and chargebacks create a feedback loop. Higher chargebacks increase your risk profile, which increases reserves, which reduces available cash flow, which can lead to slower fulfillment or reduced customer service capacity, which can generate more disputes. Understanding this loop is the foundation for breaking it.
A critical misconception is that reserves are fixed penalties. They’re not. They’re risk assessments, and risk assessments are based on data that you can influence. Your processor isn’t punishing you. They’re pricing your risk. Change the risk inputs, and the reserve output changes.

An elevated chargeback ratio does more than reduce revenue—it can trigger higher reserves that restrict the cash needed to improve operations.
The Framework: Four Phases of Reserve Reduction
Reducing reserve requirements isn’t a single action. It’s a cycle with four interconnected phases that you repeat as your business grows and your processing relationship matures.
- Phase 1: Measure and Map — Establish your current chargeback ratio, reserve terms, and cash flow impact with precision.
- Phase 2: Prevent and Defend — Reduce dispute volume through prevention systems and contest disputes worth fighting.
- Phase 3: Demonstrate and Negotiate — Use your improved metrics to proactively request better reserve terms from your processor.
- Phase 4: Monitor and Maintain — Build ongoing systems that keep your ratio low as transaction volume increases.
These phases aren’t strictly sequential. You’ll often work on prevention and measurement simultaneously. But the negotiation phase only works after you have documented improvement to present. Let’s break each phase down.
Step-by-Step Breakdown: Reducing Reserves Through Dispute Ratio Control
Step 1: Map Your Current Reserve Position and Cash Flow Impact
Objective: Know exactly how much capital is held, under what terms, and what your current chargeback ratio is across all card networks.
Start by pulling your current processing agreement and identifying the specific reserve clause. Note the percentage withheld, the hold duration, and any release conditions. Many eCommerce managers discover they don’t actually know their reserve terms because the clause was buried in onboarding paperwork they signed months or years ago.
Next, calculate your effective chargeback ratio for the past six months, broken out by month. Don’t use your processor’s dashboard number alone. Verify it against your own transaction records. Discrepancies happen, and they matter when you’re building a case for renegotiation later. Track the ratio by card network separately, since Visa and Mastercard calculate and enforce thresholds differently.
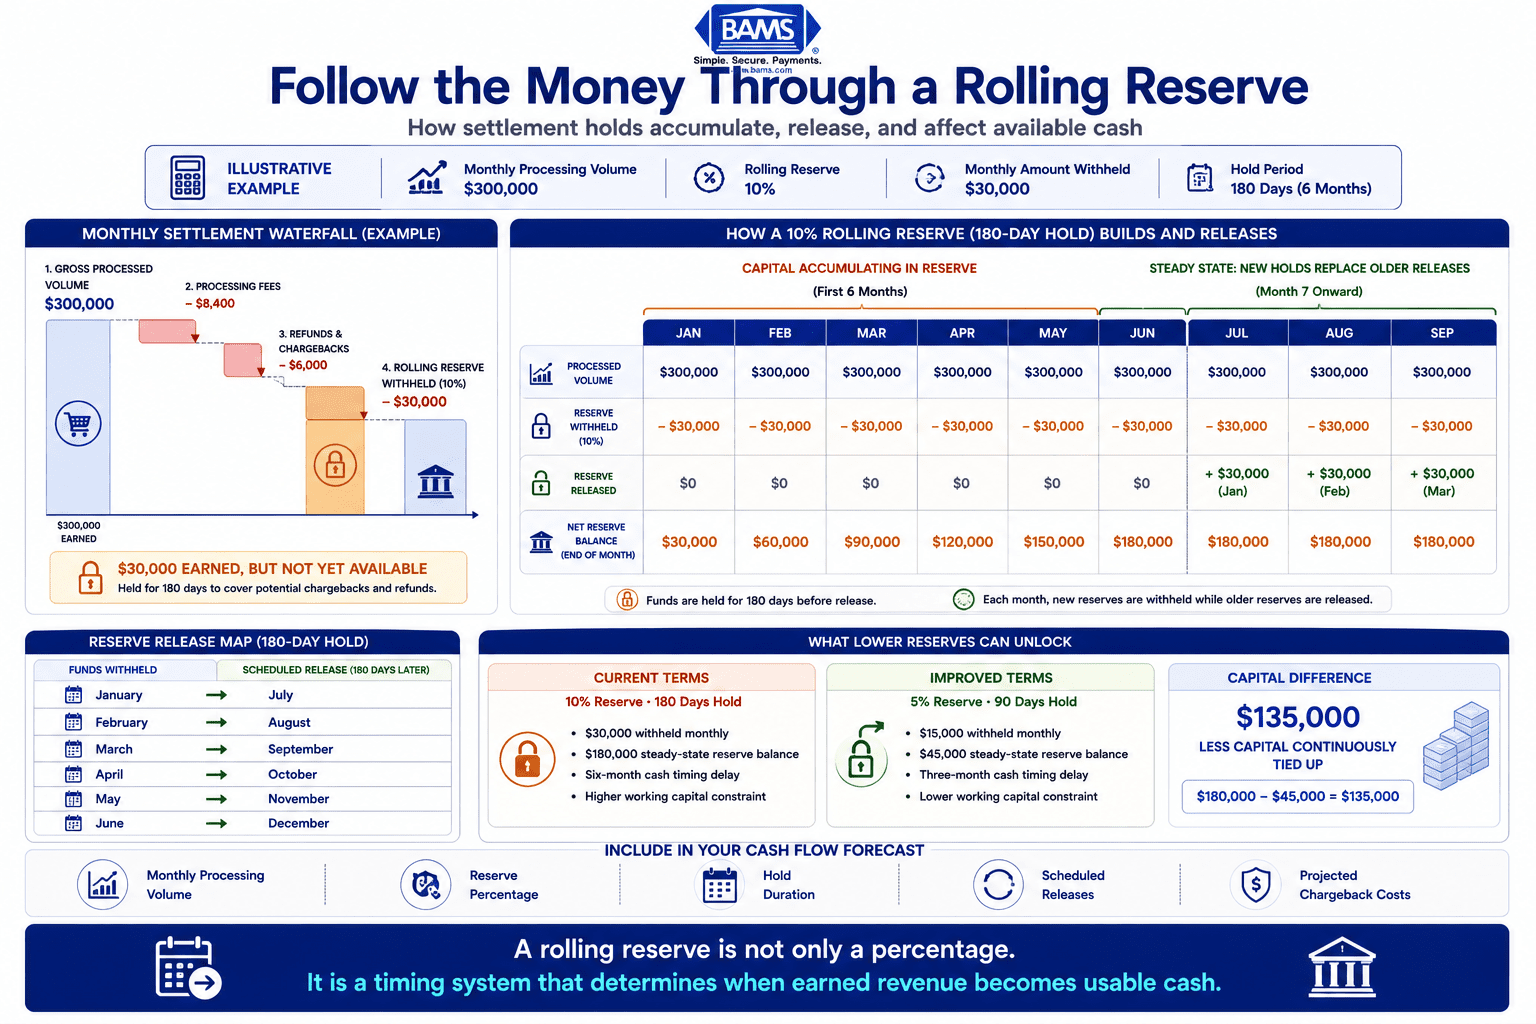
Then quantify the cash flow impact. Multiply your average monthly processing volume by your reserve percentage. That’s the capital sitting in limbo each month. For rolling reserves, calculate the total amount held at any given time (monthly reserve amount multiplied by the number of months in the hold period). This number is your baseline, the figure you’re working to reduce.
Anti-patterns: Don’t estimate. Don’t assume your ratio is “probably fine.” Don’t ignore network-specific breakdowns. Aggregated numbers hide problems.
Success indicators: You can state your exact chargeback ratio per network, your total reserve balance, and the monthly cash flow impact in dollar terms.
Step 2: Build a Multi-Layer Prevention System
Objective: Reduce the volume of disputes reaching your processor before they affect your ratio.
Prevention is where the highest leverage exists. Nearly 79% of disputes are classified as friendly fraud, meaning the cardholder received the product or service but disputes the charge anyway. This is not a fraud problem you solve with fraud filters alone. It’s an experience, communication, and documentation problem.
Start with your billing descriptor. If customers see a charge from “PARENT CORP LLC” instead of your brand name, they’ll dispute it out of confusion. This single fix eliminates a measurable percentage of friendly fraud disputes. Next, implement pre-dispute alerts through services like Ethoca and Verifi, which notify you when a cardholder initiates a dispute, giving you a window to issue a refund before it becomes a formal chargeback on your ratio.
Layer in clear delivery confirmation with tracking, proactive shipping delay notifications, and easy-to-find refund policies. Every barrier you remove between a frustrated customer and your support team is a dispute that never reaches your processor. Consider implementing order confirmation emails that include your billing descriptor name, support contact information, and a direct link to request a refund.
Anti-patterns: Don’t rely solely on fraud filters. They catch actual fraud but do nothing for friendly fraud, which is the majority of disputes. Don’t make your refund process harder than your dispute process.
Success indicators: Your dispute volume (not just ratio) decreases month over month. Pre-dispute alerts are resolving cases before they become chargebacks. Customer service contacts about billing confusion decline.
Step 3: Contest Disputes Strategically Through Representment
Objective: Recover revenue from winnable disputes and signal to your processor that you actively manage risk.
Not every chargeback is worth fighting. Merchants win roughly 41% of representment cases, but the net recovery rate after costs and second chargebacks falls to 12–18%. This means you need a triage system, not a blanket policy of contesting everything or accepting everything.
Build a representment decision framework based on three factors: the dollar value of the transaction, the strength of your evidence (delivery confirmation, customer communication logs, usage data), and the likelihood of a second chargeback even if you win. High-value transactions with strong evidence are worth contesting. Low-value transactions with weak evidence are better absorbed as a cost of business.
The representment process itself matters to your processor relationship. When you contest and win disputes, you demonstrate active risk management. This creates a documented track record that supports reserve renegotiation in Phase 3. Even losses, when accompanied by thorough evidence packages, show your processor that you’re not passively accepting financial exposure. Mastercard also recommends structured chargeback response processes and emphasizes timely evidence submission as an important part of successful dispute management. Additional guidance is available in Mastercard’s merchant chargeback guidance.
Tools like BAMS’ proactive chargeback defense can streamline this process by handling evidence compilation and submission, reducing the operational burden on your team while maintaining consistent representment quality.
Anti-patterns: Don’t contest every dispute regardless of evidence strength. Don’t ignore representment entirely because the win rates seem low. Don’t submit generic evidence packages. Tailor each response to the specific reason code.
Success indicators: You have a documented win rate above 30%. Your representment process takes less than 48 hours per case. Your processor sees consistent, professional dispute responses from your account.
Step 4: Negotiate Reserve Terms Proactively
Objective: Use your improved metrics to request specific, measurable reductions in reserve percentage or hold duration.
This is the step most eCommerce businesses never take. They assume reserves are non-negotiable. They’re not. Reserves are risk pricing, and when your risk profile improves, you have standing to request better terms. The key is approaching the conversation with data, not complaints.
The Office of the Comptroller of the Currency’s Merchant Processing Handbook explains how merchant acquirers evaluate processing risk, reserve requirements, and ongoing account monitoring as part of merchant processing relationships.
Prepare a reserve review package that includes: your chargeback ratio trend over the past 6–12 months (showing improvement), your representment activity and win rate, the specific prevention measures you’ve implemented, and your projected processing volume for the next quarter. Present this to your account manager, not to a general support line.
Request specific changes. Don’t ask to “reduce my reserve.” Ask to move from a 10% rolling reserve with a 180-day hold to a 5% rolling reserve with a 90-day hold. Concrete requests get concrete responses. If your processor won’t negotiate, that’s valuable information about whether your processing relationship is serving your growth.
The businesses that maintain the strongest merchant services relationships and positive cash flow are the ones that treat their processor as a partner, not a utility. Regular communication about your business trajectory, seasonal patterns, and growth plans gives your processor context that generic risk algorithms miss.
Anti-patterns: Don’t wait for your processor to offer better terms. They won’t. Don’t negotiate without data, don’t threaten to leave without having an actual alternative lined up and don’t accept “that’s our standard policy” without escalating to a decision-maker.
Success indicators: You receive a written response to your reserve review request within 30 days. Your reserve percentage or hold duration decreases. You have a scheduled next review date.
Step 5: Build a Cash Flow Forecasting Model That Accounts for Reserves
Rolling reserves create a timing gap between earning revenue and being able to use it, making the release schedule essential to cash flow planning.
Objective: Eliminate reserve-related cash flow surprises by building holds into your financial planning.
Even while you work to reduce reserves, you need to plan around them. Most eCommerce businesses forecast revenue based on gross sales minus COGS, fees, and refunds. Reserves rarely appear in these models, which means the gap between expected and actual available cash widens as volume grows.
Build a simple rolling forecast that includes: gross processing volume, reserve percentage withheld, reserve release schedule (when held funds become available), net available cash per period, and projected chargeback costs. For rolling reserves, model the “waterfall” effect: funds withheld this month release in 90 or 180 days, creating a delayed cash inflow that you can plan around once you map it.
This model becomes especially important during high-growth periods or seasonal spikes. If your November sales double, your reserve hold doubles too. Without forecasting, that cash gap can create real operational strain in December and January, exactly when you need capital for post-holiday fulfillment and Q1 inventory.
Anti-patterns: Don’t treat reserves as a static number. They fluctuate with volume. Don’t ignore the timing mismatch between when funds are held and when they’re released. Don’t build your model once and forget it.
Success indicators: Your actual available cash matches your forecast within 5% each month. You can predict reserve-related cash gaps 60–90 days in advance. Seasonal spikes don’t create unexpected liquidity crunches.
Step 6: Maintain Low Ratios as Transaction Volume Scales
Objective: Ensure that volume growth doesn’t erode the ratio improvements you’ve achieved.
Here’s the math that catches growing businesses off guard. If you process 10,000 transactions per month with 50 chargebacks, your ratio is 0.50%. If you grow to 20,000 transactions but chargebacks grow proportionally to 100, your ratio stays the same. But if chargebacks grow faster than transactions (which they often do during rapid scaling because new customer segments, new marketing channels, and new product lines each introduce new dispute patterns), your ratio climbs even though your per-transaction quality hasn’t changed.
Build monitoring systems that flag ratio changes weekly, not monthly. Segment your chargeback data by acquisition channel, product category, and customer cohort. This segmentation reveals which growth vectors are introducing dispute risk so you can address them surgically rather than applying blanket policies that slow all growth.
Implement a chargeback risk management framework that scales with your business. This means automated alerts when any segment’s ratio exceeds a threshold, documented response procedures for each chargeback reason code, and regular (quarterly minimum) reviews of your prevention stack’s effectiveness against current dispute patterns.
Anti-patterns: Don’t assume a low ratio will stay low automatically during growth. Don’t wait for monthly reports to catch ratio spikes. Don’t apply the same prevention tactics to every product line or customer segment without analyzing their specific dispute profiles.
Success indicators: Your ratio remains stable or improves as transaction volume increases. You can identify which business segments contribute most to disputes within 24 hours of a ratio change. Your prevention measures evolve as your product mix and customer base evolve.
Practical Examples: How Reserve Dynamics Play Out During Growth
Scenario A: The Seasonal Scaling Trap
An online home goods retailer processes $200,000/month with a 0.45% chargeback ratio and no reserve requirement. During Q4, volume jumps to $600,000/month. New customers from paid social campaigns generate a higher dispute rate. By January, the ratio has climbed to 0.85%. The processor imposes a 10% rolling reserve with a 180-day hold.
The impact: $60,000/month is now held for six months. By March, $180,000 is sitting in reserve. The retailer needs that capital for spring inventory but can’t access it. The reserve wasn’t caused by fraud. It was caused by a growth pattern that introduced new customer segments with different dispute behaviors, and the retailer didn’t adjust prevention tactics for those segments.
Scenario B: The Proactive Approach
A similar retailer anticipates Q4 growth and takes action in September. They implement pre-dispute alerts, update billing descriptors, add order confirmation emails with support contact details, and brief their customer service team on dispute-prone product categories. They also notify their processor of expected volume increases and share their prevention plan.
Q4 volume triples, but the chargeback ratio holds at 0.50%. No reserve is imposed. The $180,000 that would have been locked in Scenario A is available for inventory, marketing, and operations. The difference isn’t luck. It’s preparation.
The Compounding Effect Over 12 Months
Consider two businesses processing identical volume of $300,000/month. Business A has a 0.80% ratio and a 10% reserve. Business B has a 0.40% ratio and no reserve. Over 12 months, Business A has approximately $360,000 cycling through reserve holds at any given time (assuming a 6-month rolling reserve). Business B has zero. That’s $360,000 in working capital difference, not from revenue differences, but from dispute management differences. This is why merchant cash flow optimization starts with chargeback ratio control.
Common Mistakes and Pitfalls
- Treating reserves as permanent. Many merchants accept their initial reserve terms and never revisit them. Reserves are meant to be reviewed as your risk profile changes. If your ratio has improved, request a review.
- Focusing on fraud prevention while ignoring friendly fraud.Friendly fraud accounts for nearly 79% of disputes. Fraud filters alone won’t move your ratio meaningfully.
- Waiting for the processor to act. Processors impose reserves reactively. If you wait for a reserve notification, you’ve already lost the negotiating position. Proactive communication consistently produces better outcomes.
- Ignoring the ratio during growth. A stable absolute number of chargebacks can mask a rising ratio if transaction volume fluctuates. Always monitor the ratio, not just the count.
- Choosing a processor based on rates alone. The cheapest per-transaction rate means nothing if aggressive reserve policies lock up 10% of your settlement. Evaluate merchant services holistically, including reserve terms, funding speed, and dispute support.
What to Do Next
Start with Step 1. Pull your processing agreement today and identify your current reserve terms, hold duration, and release conditions. Calculate your chargeback ratio for the past six months. Quantify the dollar amount sitting in reserve right now.
That single exercise will tell you whether reserves are a minor line item or a significant cash flow constraint for your business. If the number surprises you, that’s a sign this framework will deliver meaningful results.
You don’t need to overhaul everything at once. Implement one prevention measure this week (billing descriptor update or pre-dispute alerts are the highest-leverage starting points). Track the impact for 60 days. Then use that data to start a conversation with your processor about your reserve terms.
Reserve reduction is incremental. Each improvement in your dispute ratio creates a documented basis for requesting better terms. Over six to twelve months, the compounding effect of lower reserves, faster access to funds, and reduced chargeback costs can meaningfully change your business’s financial flexibility. Treat this guide as a reference you return to at each phase, not a checklist you complete once.
Frequently Asked Questions
What is reserve and hold management in merchant services?
Reserve management is the process of understanding, forecasting, and actively working to reduce the percentage of your processed revenue that your payment processor withholds as a risk buffer. Processors hold reserves to protect themselves against future chargebacks, refunds, or fraud losses on your account. Managing reserves means treating them as a negotiable variable tied to your dispute metrics, not a fixed cost of processing payments.
Why do payment processors withhold reserves from merchants?
Processors withhold reserves because they bear financial liability when a chargeback occurs. If a customer disputes a charge and the processor has already deposited those funds to your account, the processor must return the money to the cardholder. Reserves ensure the processor has funds available to cover those reversals. The higher your chargeback ratio or perceived risk, the larger the reserve your processor will require.
How do rolling reserves work in payment processing?
A rolling reserve withholds a fixed percentage of each settlement (commonly 5–10%) and holds it for a set period, typically 90 to 180 days. After the hold period expires, those specific funds are released to you. This creates a continuous cycle: new funds are always being held while older funds are being released. The total amount in reserve at any given time equals your average monthly reserve amount multiplied by the number of months in the hold period.
When can a merchant expect to have their reserves released?
Release timing depends on your reserve type and terms. Rolling reserves release automatically after the hold period (90–180 days). Capped reserves release once you’ve built up the required balance and maintained acceptable metrics. In some cases, you can negotiate an early release by demonstrating a sustained low chargeback ratio and stable processing history. The key is asking proactively and presenting data that supports the request.
Which factors influence the percentage of reserves withheld by payment processors?
The primary factors include your chargeback ratio, your industry category, your processing history length, your average transaction size, your refund rate, and your monthly volume. Sudden volume spikes, high-ticket items, and subscription billing models can also increase reserve requirements. Processors use these inputs in risk models that determine your specific terms, which is why improving any of these factors can lead to lower reserves.
How can merchants reduce their reserve requirements over time?
Reduce your chargeback ratio through prevention (billing descriptors, pre-dispute alerts, clear refund policies), contest winnable disputes through representment, and then use your improved metrics to negotiate with your processor. Present a data package showing your ratio trend, prevention measures, and representment activity. Request specific reductions in percentage or hold duration. Most processors will review terms for merchants who demonstrate sustained improvement over 6–12 months.
Source
- https://corporate.visa.com/en/solutions/acceptance/chargebacks.html
- https://www.mastercard.com/us/en/news-and-trends/Insights/2024/how-can-merchants-dispute-credit-card-chargebacks.html
- https://www.occ.treas.gov/publications-and-resources/publications/comptrollers-handbook/files/merchant-processing/pub-ch-merchant-processing.pdf


