
How to Audit Your Payment Processing Fees
Last Updated on October 14, 2026 by Dimitri Akhrin
A practical guide to reading merchant statements, spotting hidden markup, and reclaiming lost margin
Learn how to break down your merchant processing statement, distinguish interchange costs from processor markup, and identify fee categories silently draining your margins. Built for eCommerce operators processing $1M–$5M annually.
TL;DR
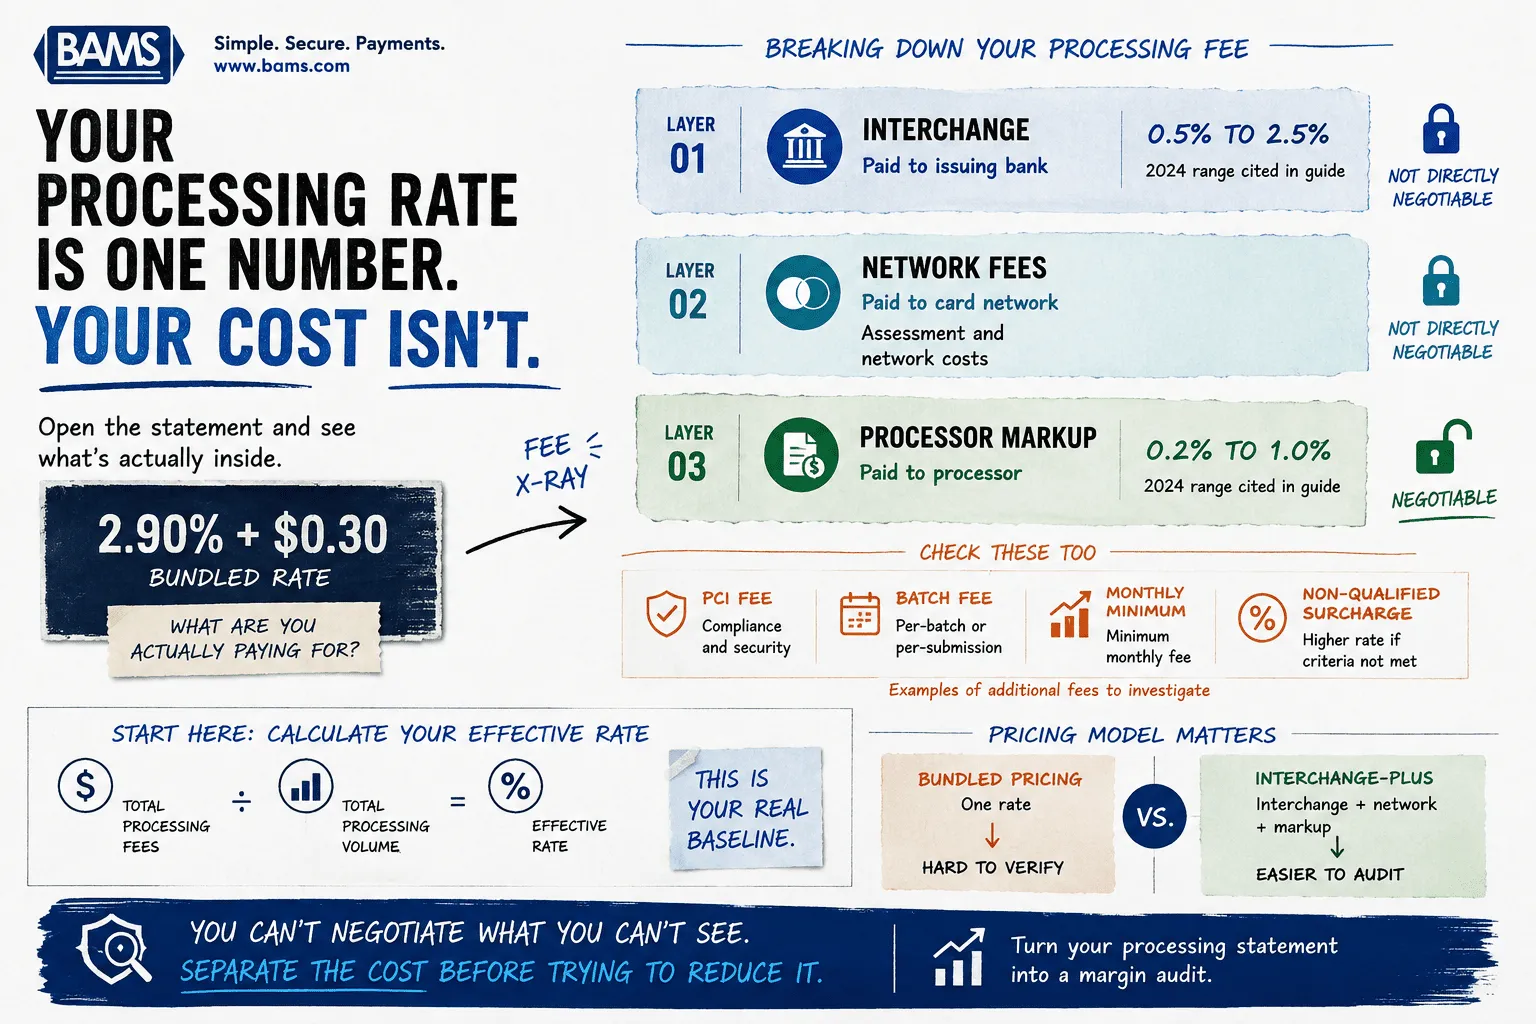
- Your processing fee has three layers – Interchange (to the bank), network fees (to Visa/Mastercard), and processor markup. Only the processor markup is negotiable, and bundled pricing hides all three in one opaque number.
- Interchange-plus pricing is the audit enabler – It separates network costs from processor margin so you can verify whether your fees are fair. Without it, you’re trusting a number you can’t check.
- Calculate your effective rate first – Divide total fees by total volume. If you’re above 2.5% on significant eCommerce volume, there’s almost certainly room to optimize through pricing model changes, junk fee elimination, or both.
- Faster deposits are a cash flow tool, not a luxury – Aligning batch timing with ACH cutoffs and maintaining a low chargeback ratio can accelerate deposits without switching processors or paying premiums.
- Audit quarterly, not once – Fee creep is real. A recurring audit habit protects your baseline and turns payment processing from a passive cost into an active growth lever.
Guide Orientation: What This Covers and Who It’s For
This guide teaches eCommerce operators how to audit their payment processing fees, understand what they’re actually paying, and use faster deposit timing as a genuine growth lever. It’s built for eCommerce managers at established online businesses (roughly 10 to 50 employees) who suspect they’re overpaying but don’t know how to verify it.
By the end, you’ll be able to read a merchant processing statement with confidence, distinguish between interchange costs and processor markup, identify the specific fee categories draining your margins, and connect deposit speed to measurable cash flow improvement.
This guide does not cover enterprise payment orchestration, multi-currency optimization, or gateway migration. It focuses on the audit skill itself: how to see what you’re paying, decide if it’s fair, and act on what you find.
Why Payment Processing Fee Literacy Matters Now
Payment acceptance costs represent a substantial expense across the U.S. card ecosystem. The Federal Reserve Bank of St. Louis reports that U.S. banks collected nearly $66 billion in interchange fees in 2025, up from $64 billion in 2024 and $52 billion in 2021. For eCommerce operators, understanding exactly how those underlying costs flow through a processing statement is essential to identifying avoidable markup.
For a mid-size eCommerce operation processing $1 million to $5 million annually, even a 0.3% discrepancy between what you should pay and what you actually pay represents $3,000 to $15,000 in annual margin loss. Multiply that over several years and you’re looking at a significant reinvestment opportunity that simply evaporated.
The core problem isn’t that processors are charging fees. Fees are real and necessary. The problem is that most eCommerce operators accept a bundled rate without understanding the components inside it. They can’t tell whether a rate increase reflects genuine interchange adjustments from the card networks or a quiet margin expansion by their processor.
This gap in fee literacy creates a compounding disadvantage. You can’t negotiate what you can’t see. You can’t benchmark what you don’t understand. And you can’t connect deposit timing to cash flow strategy if you don’t know how much of each transaction actually reaches you.
The cost of inaction isn’t dramatic. It’s slow. It’s the steady leak of margin that funds your competitor’s ad spend, inventory purchases, and hiring decisions while you wonder why growth feels harder than the revenue numbers suggest it should.
Core Concepts: The Anatomy of a Processing Fee

Your effective processing rate is only the starting point. Breaking the number into interchange, network costs and processor markup shows which costs are fixed and which ones you can actually address.
The Three Layers of Every Transaction Fee
Card processing costs can include multiple components, and understanding how they appear on your statement is the foundation of fee literacy. Interchange is one major component, while your processor agreement can include additional processing and service charges. The goal of the audit is to separate these costs so you can see which ones are determined by the payment system and which ones come from your processor relationship.
Interchange-related costs vary based on factors such as card product, transaction type and merchant category. Visa publishes detailed U.S. interchange schedules showing different rates and qualification categories across its card products and transaction types.
Processor fees are determined by your payment processor and merchant agreement. Unlike a published network interchange schedule, these charges depend on the pricing model and services negotiated with your provider, which is why isolating processor-specific costs is an important part of the audit.
Bundled vs. Interchange-Plus Pricing: The Critical Distinction
Under bundled (or tiered) pricing, your processor combines all three layers into a single rate. You see one number on your statement: maybe 2.9% + $0.30. You have no way to know how much of that goes to interchange, how much to the network, and how much is processor margin.
Under interchange-plus pricing, each layer is itemized. You see the exact interchange rate for each transaction category, plus a fixed processor markup. This is what makes it possible to verify whether your costs are fair. It’s the difference between a restaurant bill that says “$47” and one that shows each dish, tax, and tip separately.
This distinction isn’t academic. It’s the single most important structural decision in your payment processing relationship, because it determines whether you can audit your costs at all.
The Fee Audit and Cash Flow Framework
This guide follows a five-stage process that connects fee visibility to deposit speed to growth capital. Each stage builds on the previous one:
- Stage 1: Extract — Pull the raw data from your current processing statements
- Stage 2: Decode — Separate interchange, network, and processor fees to find your effective rate
- Stage 3: Benchmark — Compare your costs against known interchange tables and industry averages
- Stage 4: Accelerate — Optimize deposit timing to convert revenue into usable cash faster
- Stage 5: Reinvest — Channel recovered margin and faster cash flow into specific growth activities
These stages are sequential for your first audit. After that, stages 2 through 5 become a recurring cycle you can run quarterly to keep your processing costs honest and your cash flow predictable.
Step-by-Step Breakdown: Auditing Your Fees and Accelerating Deposits
Step 1: Extract Your Processing Data
Objective: Gather three to six months of complete processing statements so you have enough data to identify patterns, not just snapshots.
Start by downloading your monthly merchant processing statements from your processor’s portal. You need the detailed versions, not the summary invoices. Look for statements that show individual transaction categories, not just a total amount debited from your account.
While you’re collecting statements, pull your gateway transaction reports for the same period. Cross-referencing gateway data against processor statements reveals discrepancies: transactions that were processed but not settled, batch timing gaps, and fee categories that appear on statements but don’t correspond to actual transaction activity.
Create a simple spreadsheet with monthly columns for: total processing volume, total fees charged, number of transactions, and any additional line-item fees (PCI compliance, statement fees, batch fees, chargeback fees). This becomes your baseline.
Anti-patterns: Don’t rely on a single month. Seasonal volume shifts, promotional periods, and card mix changes make any single month unreliable. Don’t accept summary-level data. If your processor only provides summary statements, that itself is a red flag worth investigating.
Success indicators: You have a spreadsheet showing month-over-month total volume, total fees, and a calculated “all-in” percentage for each month. If that percentage varies by more than 0.2% month to month without a clear reason (like a shift in card mix), you’ve already found something worth investigating.
Step 2: Decode Your Fee Structure
Objective: Determine whether you’re on bundled or interchange-plus pricing, and isolate the processor’s markup from network costs.
Look at your statement’s fee section. If you see categories like “qualified,” “mid-qualified,” and “non-qualified” with different rates, you’re on tiered/bundled pricing. If you see line items referencing specific interchange categories (like “Visa CPS Retail” or “MC Merit III”) with a consistent markup added, you’re on interchange-plus.
If you’re on bundled pricing, your immediate task is calculating your effective processing rate: total fees divided by total volume. Then compare that result against your merchant agreement, transaction mix and the applicable published interchange categories. A higher effective rate is not automatically evidence of excess markup, but unexplained differences give you specific fees or transaction categories to investigate.
If you’re on interchange-plus, isolate the processor markup component. Compare that markup against the pricing in your merchant agreement and any competitive quotes you have received. If the amount on your statement differs from the agreed pricing or has increased without a clear explanation, that deserves a conversation with your processor.
Also scan for “junk fees,” line items that don’t correspond to any real service: monthly minimums you consistently exceed, PCI non-compliance fees when you are compliant, or batch processing fees that seem inflated relative to your volume.
Anti-patterns: Don’t assume your pricing model is what you were told at sign-up. Contracts change. Rates adjust. Verify against the actual statement, not your memory of the sales conversation. Don’t ignore per-transaction fees. On high-volume, low-ticket businesses, the per-transaction component can exceed the percentage component in total cost impact.
Success indicators: You can state with confidence: “I’m on [bundled/interchange-plus] pricing. My effective rate is X%. My processor’s markup is approximately Y%.” If you can’t make that statement, you need more detailed statements from your processor.
Step 3: Benchmark Against Known Interchange Rates
Objective: Determine whether your costs align with published interchange schedules or whether you’re paying a premium that can’t be explained by your transaction profile.
Visa and Mastercard publish their interchange rate tables. These are public documents, updated periodically. Download the current versions and identify the categories that match your business: card-not-present, eCommerce, recurring billing, or whatever applies to your transaction mix.
Interchange does not have one universal eCommerce rate. Visa’s published U.S. interchange schedule contains different categories based on card product, transaction characteristics, merchant type and qualification requirements. Your actual interchange mix therefore depends on the types of cards and transactions your business processes.
Compare your statement’s interchange charges against these published rates. If you’re on interchange-plus, this is straightforward: the interchange portion should match the published tables. If you’re on bundled pricing, you can only compare your total effective rate against the sum of expected interchange plus a reasonable processor margin. Any gap between expected and actual is either unexplained margin or a fee category you haven’t identified.
This is also where understanding your card mix matters. If 60% of your transactions are rewards credit cards, your interchange baseline is naturally higher than a business processing mostly debit. Benchmarking without accounting for card mix leads to false conclusions.
Anti-patterns: Don’t compare your rates against a friend’s restaurant processing rates. Interchange varies dramatically by merchant category, card type, and transaction method. Card-not-present eCommerce inherently costs more than card-present retail. Don’t treat published interchange rates as fixed forever. Networks update them, sometimes twice a year.
Success indicators: You have a clear picture of the gap (if any) between what interchange tables say you should pay and what your statements show. You can quantify this gap in dollars per month.
Step 4: Optimize Deposit Timing for Cash Flow Advantage
Objective: Reduce the time between transaction and deposit so that revenue becomes usable working capital faster.
Your actual funding timeline depends on your processor, bank and merchant agreement. On the bank-transfer side, Nacha notes that ACH payments can be processed within hours on the same banking day or scheduled for the following banking day. Understanding where delays occur between settlement initiation and actual bank availability helps you determine whether your current funding schedule can be improved.
Start by understanding your current settlement timeline. Check your bank deposits against your gateway’s batch submission times. If your gateway batches transactions at midnight but your processor’s ACH cutoff is 10 PM, you’re adding an extra day to every deposit. Aligning batch timing with processor cutoffs is a zero-cost optimization that many businesses overlook.
Next, evaluate whether your processor offers next-day or same-day funding. This is where the relationship between fees and cash flow becomes tangible. Some processors charge a premium for faster funding. Others, like BAMS, include next-day funding as a standard feature alongside interchange-plus pricing, which means you’re not trading fee transparency for deposit speed.
Also examine your chargeback ratio. Processors often slow settlement for merchants with elevated dispute rates. Proactive chargeback defense (alerts, rapid response, clear billing descriptors) doesn’t just protect revenue. It protects your deposit timeline.
Anti-patterns: Don’t assume faster deposits always cost more. That assumption benefits processors who profit from holding your funds. Don’t switch processors solely for faster deposits without auditing the fee impact first. A faster deposit at a higher effective rate can actually reduce your net cash position.
Success indicators: You know your current average settlement time in business days. You’ve identified whether batch timing misalignment is adding unnecessary delay. You’ve calculated the working capital impact of reducing settlement by one or two days.
Step 5: Reinvest Recovered Margin into Growth
Objective: Convert fee savings and faster cash access into specific, measurable growth activities rather than letting recovered margin disappear into general operations.
Once you’ve completed your audit and optimized your fee structure and deposit timing, quantify the total monthly impact. This typically comes from three sources: direct fee reduction (lower effective rate), eliminated junk fees, and the working capital benefit of faster deposits.
Be specific about where this recovered margin goes. The most effective eCommerce operators earmark processing savings for activities with measurable return: increased ad spend with clear ROAS targets, inventory purchases that prevent stockouts during peak periods, or hiring that removes a specific operational bottleneck.
Faster deposits are particularly powerful for inventory-dependent businesses. If you can fund a restock order two days earlier because your deposits arrive next-day instead of on a three-day cycle, you reduce the window where popular SKUs show “out of stock.” That’s not just cash flow management. That’s revenue protection.
Set a quarterly review cadence. Rerun your effective rate calculation every quarter. Compare it against your baseline. Watch for rate creep, which is the gradual increase in processor fees that happens when merchants stop paying attention. Your first audit establishes the baseline. Subsequent audits protect it.
Anti-patterns: Don’t treat fee savings as “found money” that can absorb unplanned expenses. That erases the growth leverage. Don’t stop auditing after the first round. Processors adjust rates, card networks update interchange tables, and your transaction mix evolves. A one-time audit is a snapshot. A quarterly audit is a system.
Success indicators: You have a documented monthly dollar figure for recovered margin. You’ve allocated that figure to a specific growth initiative. You have a calendar reminder for your next quarterly audit.
Practical Examples: What This Looks Like in Practice
Scenario A: The Hidden Markup Discovery
A processing audit becomes useful when the percentage difference is converted into dollars. Even a modest rate gap can become meaningful annual margin at scale.
An eCommerce brand processing $2.4 million annually on bundled pricing sees a flat rate of 2.9% + $0.30 on their statement. Their effective rate, after accounting for all fees, is actually 3.35% because of PCI non-compliance fees, a monthly minimum charge, and an elevated “non-qualified” surcharge on rewards cards.
After switching to interchange-plus (cost-plus) pricing, their interchange averages 1.85% (reflecting their card mix), network fees add 0.13%, and the processor markup is 0.25% + $0.10. Their new effective rate is 2.28%. Annual savings: approximately $25,680. That funds a part-time customer service hire that reduces their response time and improves repeat purchase rates.
Scenario B: The Batch Timing Fix
A direct-to-consumer brand discovers their gateway batches at 11:30 PM Eastern, but their processor’s ACH cutoff is 9:00 PM. Every single day’s transactions miss the cutoff and settle a day late. By adjusting their batch time to 8:00 PM, they gain access to funds one business day sooner, every day, without changing processors or paying a premium. On $180,000 in monthly volume, that’s roughly $6,000 in additional working capital available at any given time.
Scenario C: The Chargeback-Deposit Connection
An apparel brand with a 1.4% chargeback ratio notices their processor has moved them to a delayed settlement schedule (four business days instead of two). After implementing proactive chargeback alerts, clearer billing descriptors, and a streamlined return process, their chargeback ratio drops to 0.6% over three months. The processor restores standard two-day settlement. Combined with a fee audit that eliminates $340/month in unnecessary charges, the brand redirects the savings into retargeting campaigns that generate a 4.2x return.
Common Mistakes and Pitfalls
Treating the effective rate as the only metric. Your effective rate matters, but it doesn’t capture timing. A 2.3% effective rate with five-day settlement can be worse for your business than 2.5% with next-day funding, depending on your cash flow needs.
Auditing fees without understanding card mix. If your customer base shifts toward more rewards cards or corporate purchasing cards, your interchange costs rise regardless of your processor’s behavior. Blaming your processor for interchange increases you can’t control wastes negotiating capital.
Negotiating before understanding. Merchants who call their processor demanding lower rates before completing a proper audit often accept cosmetic concessions (a waived monthly fee, a small rate reduction) that don’t address the structural issue. Audit first. Negotiate with data.
Ignoring the audit after the first round. Fee creep is real. Processors add small charges incrementally, counting on merchants not to notice. A single audit is valuable. A recurring audit is transformational.
Conflating transparency with cheapness.Transparent pricing doesn’t guarantee the lowest cost. It guarantees you can see the cost. That visibility is what gives you the power to optimize, negotiate, and make informed decisions about your payment processing relationship.
What to Do Next
Start with one month’s statement. Calculate your effective rate (total fees divided by total volume). If you can’t separate interchange from processor markup on your statement, you’re on bundled pricing, and that’s the first thing to address.
Don’t try to overhaul your entire payment infrastructure this week. Instead, build the habit of reading your processing statement the same way you read your P&L: monthly, with attention to what changed and why.
If your effective rate is above 2.5% and you’re processing more than $50,000 monthly, an interchange-plus pricing conversation with your processor (or a new one) is likely worth your time. If your deposits take more than two business days consistently, investigate batch timing before assuming you need to switch providers.
Use this guide as a reference, not a one-time checklist. Revisit your benchmarks quarterly. The merchants who treat fee literacy as an ongoing practice, rather than a one-time project, are the ones who turn payments from a cost center into a genuine growth lever.
Frequently Asked Questions
What are payment processing fees, and why do they vary so much?
Payment processing fees are the combined costs of interchange (paid to the cardholder’s bank), network assessments (paid to Visa/Mastercard), and processor markup (paid to your payment processor). They vary based on card type (debit vs. rewards credit), transaction method (card-present vs. online), merchant category, and your pricing model. Two businesses with identical revenue can pay very different effective rates based on these factors.
How do I know if I’m on interchange-plus pricing or bundled pricing?
Check your monthly processing statement. If you see fee categories labeled “qualified,” “mid-qualified,” and “non-qualified,” you’re on bundled (tiered) pricing. If you see specific interchange category names (like “Visa CPS E-Commerce” or “MC World Elite”) with a consistent markup added on top, you’re on interchange-plus. When in doubt, call your processor and ask directly. The answer tells you whether you can audit your costs effectively.
When should eCommerce merchants conduct a payment processing audit?
Run your first audit as soon as possible, using three to six months of statements for reliable data. After that, repeat the core calculations (effective rate, processor markup, junk fee scan) quarterly. Also audit after any significant change: a new product line, a shift in average order value, a change in your customer demographic, or any notification from your processor about rate adjustments.
Which factors affect the speed of payment deposits for eCommerce businesses?
Four main factors control deposit speed: your processor’s standard settlement timeline, your gateway’s batch submission time relative to the processor’s ACH cutoff, your chargeback ratio (elevated ratios often trigger delayed settlement), and your account’s risk profile. Aligning batch timing with ACH cutoffs is often the fastest, free optimization available.
How do chargebacks impact more than just the disputed transaction?
Beyond losing the transaction amount and paying a chargeback fee ($15 to $100 per dispute), elevated chargeback ratios can trigger slower deposit schedules, higher processing rates, reserve holds on your account, and in severe cases, account termination. Proactive chargeback prevention protects revenue, deposit speed, and your processor relationship simultaneously.
Is interchange-plus pricing always cheaper than bundled pricing?
Not necessarily. Interchange-plus is always more transparent, but “cheaper” depends on your transaction profile and the specific markup your processor charges. The real advantage of interchange-plus is visibility: you can see exactly what you’re paying and verify whether it’s fair. That visibility enables optimization and informed negotiation, which typically results in lower costs over time.
Sources
- Federal Reserve Bank of St. Louis: Credit and Debit Card Fees Collected by U.S. Banks Rose in 2025
- Visa: U.S.A. Interchange Reimbursement Fees
- Nacha: ACH Payments Fact Sheet


