
Revenue Recognition: Why Your Dashboard Gap Isn’t Normal
The persistent shortfall between gross sales and bank deposits is a leak — not a timing variance you should ignore
Learn why the recurring gap between your dashboard total and your actual bank deposit signals real revenue loss, not routine timing noise. This piece exposes how fee structures obscure deductions and explains why transparent pricing is the structural fix.
TL;DR
- The dashboard-to-deposit gap isn’t just timing – Persistent shortfalls between your gross sales calculation and your bank balance usually signal hidden or bundled processing fees, not normal settlement delays.
- Your effective rate is the truth – Calculate total fees divided by total volume. If it’s higher than your contracted rate, you’re overpaying, potentially by tens of thousands annually.
- Reconciliation should be diagnosis, not bookkeeping – Stop asking “do the numbers match?” and start asking “why don’t they, and is this acceptable?” That shift turns a back-office task into a strategic lever.
- Deposit predictability drives growth – Every dollar you can’t account for is a dollar you can’t reinvest. Transparent pricing and next-day funding eliminate the guesswork and unlock forward planning.
The Number You Trust Is Lying to You
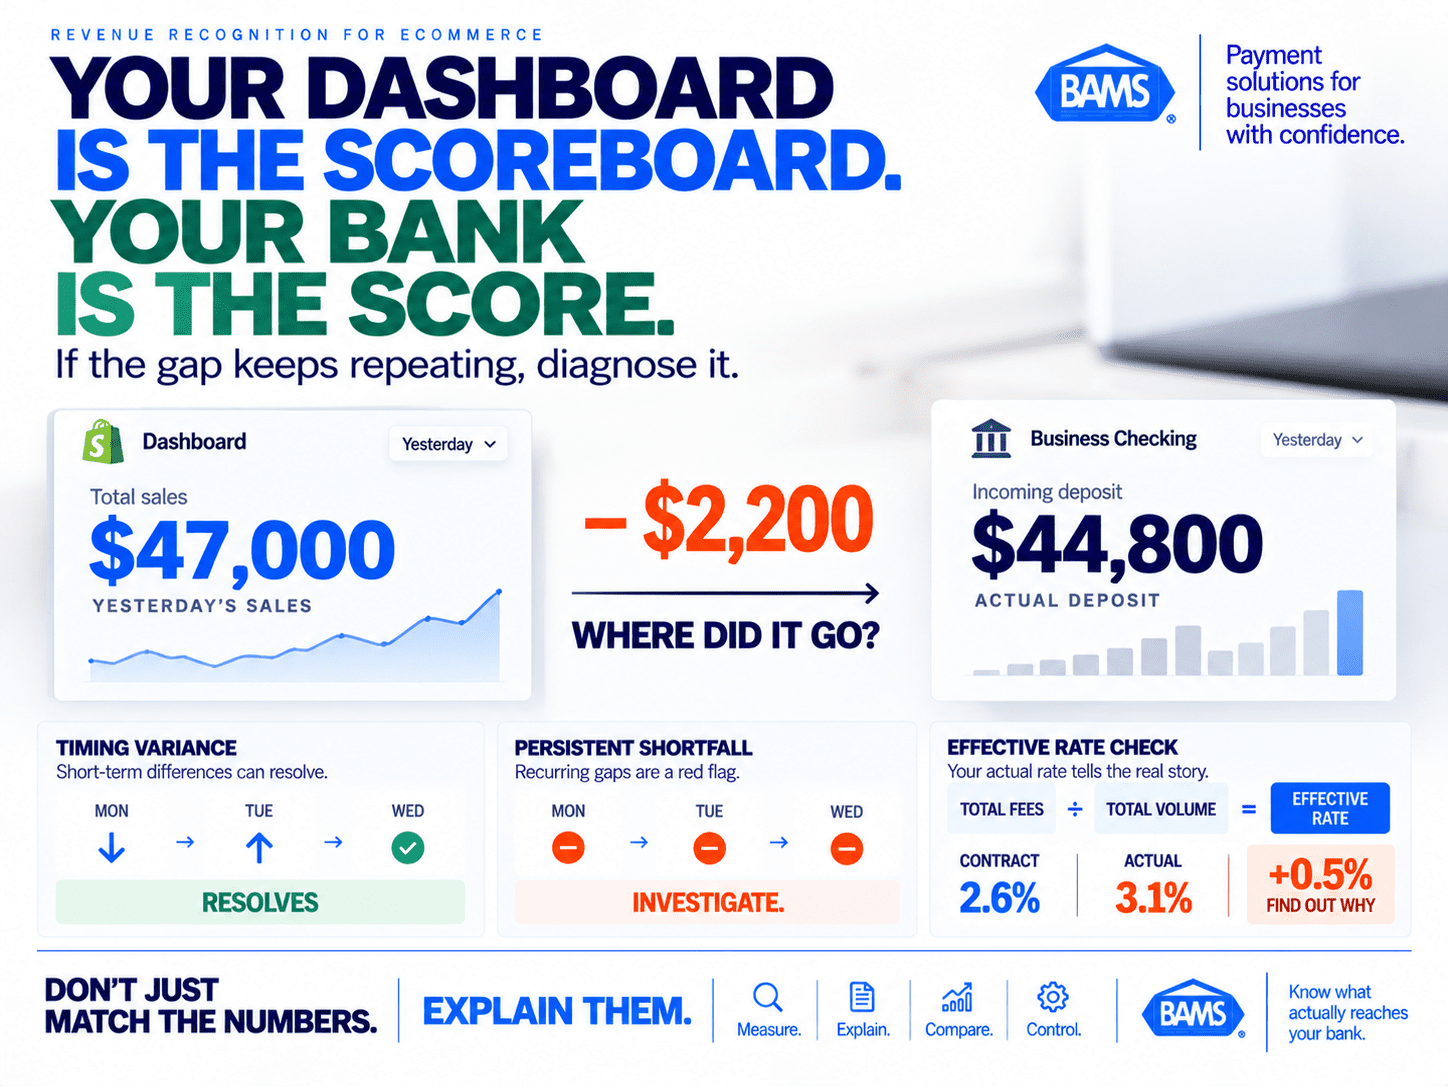
Your dashboard says you did $47,000 yesterday. Your bank deposit says $44,800. You shrug, assume it’ll sort itself out, and move on. But it doesn’t sort itself out. It happens again tomorrow, and the day after that. That gap between your gross sales calculation and your actual deposit isn’t noise. It’s a leak. And every day you ignore it, you’re funding someone else’s margin with money you already earned.

Temporary settlement differences resolve. Persistent unexplained shortfalls do not. Compare what your dashboard reports with what actually reaches your bank.
Why Everyone Treats the Gap as “Normal”
The payments industry has trained merchants to accept deposit shortfalls as a cost of doing business. Timing variances, batch windows, weekend holds, interchange fees, assessment fees, processor markups. There are so many moving parts that most eCommerce operators eventually stop questioning the delta and start budgeting around it.
And honestly? That used to be a defensible position. When your processor deposited funds in 48 to 72 hours and fee structures were buried in 30-page merchant agreements, the reconciliation math was genuinely hard. The conventional wisdom became: “Just track your monthly statement and make sure nothing looks wildly off.” Finance blogs reinforced this by framing deposit reconciliation as a back-office accounting chore, something your bookkeeper handles after the fact.
But that framing has a cost. It turns a strategic signal into clerical busywork.
The Shortfall Isn’t Timing. It’s a Tax You Didn’t Agree To.
Here’s what we actually believe: the persistent gap between your dashboard revenue and your bank deposit is not a timing issue. It’s a pricing transparency issue. And until you treat it that way, you’ll keep losing money you can’t see.
Revenue Recognition Meets Reality
Let’s unpack what’s actually happening between “sale confirmed” and “cash in account.”
When a customer completes a purchase, your dashboard records gross revenue. That number feels real. It shows up in your Shopify admin, your analytics, your daily Slack update to the team. But that number has never been your money. It’s a promise, filtered through a chain of intermediaries who each take a cut before you see a dollar.
This is the core tension behind revenue recognition in eCommerce. U.S. merchants paid a record $187.20 billion in card processing fees in 2024, up from $172.05 billion the year before. That’s not a rounding error. That’s an industry extracting more from merchants year over year, often through fee categories that never appear clearly on a single statement.
Payment processing costs are made up of multiple components rather than one universal rate. Mastercard explains that interchange is one component of the Merchant Discount Rate and that merchant pricing is established by the acquirer. Those costs can vary based on factors such as card type, transaction characteristics and how the transaction qualifies. So when your deposit comes up short, you’re left guessing whether it’s a timing variance, a fee you expected, or a fee you never agreed to.
We’ve seen this pattern repeatedly.
A merchant runs $500,000 a month in gross sales. Their effective rate (total fees divided by total volume, as the U.S. Chamber of Commerce defines it) should be around 2.6% based on their contract. But when they actually calculate it from deposit data, it’s 3.1%. That half-percent gap? It’s $2,500 a month walking out the door. $30,000 a year. Enough to fund a product launch, a new hire, or a full quarter of ad spend.
The problem isn’t that fees exist. The problem is that most processors make it structurally difficult to see what you’re actually paying. Interchange is passed through. Assessments are bundled. Markups are layered on top. And the statement you get at month’s end is designed for compliance, not clarity.
This is where the “timing” excuse falls apart. Yes, settlement timing creates legitimate short-term variances. A Friday batch won’t land until Monday. A holiday weekend adds another day. But timing variances resolve. They net to zero over a rolling week. If your deposits are consistently short of what your dashboard predicts (even after accounting for known fees) you don’t have a timing problem. You have a fee transparency problem.
What This Means for Your Next Decision
If this thesis is right, the implications are uncomfortable. It means the reconciliation gap you’ve been ignoring isn’t a bookkeeping nuisance. It’s a direct drag on your ability to reinvest.
Every dollar that disappears between dashboard and deposit is a dollar you can’t put toward inventory, advertising, or operations. And because the gap compounds daily, the annual cost is almost always larger than merchants expect. For a mid-size eCommerce brand processing $3 to $5 million a year, even a 0.3% effective rate discrepancy represents $9,000 to $15,000 in unplanned cost.
That’s not a line item you’d approve if someone put it in front of you. But because it’s invisible by default, it gets approved by inaction every single day. The merchants who close this gap don’t just save money. They gain the deposit predictability to plan forward instead of reacting backward.
Stop Reconciling. Start Diagnosing.
Reconciliation confirms whether numbers match. Diagnosis explains why they do not. Calculate your effective rate and investigate recurring differences that remain after known fees and settlement timing are accounted for.
The mental model shift is this: reconciliation is not the goal. Diagnosis is.
Reconciliation asks, “Does my ledger match my bank?” Diagnosis asks, “Why doesn’t it, and is that acceptable?” One is a task. The other is a strategy. When you move from matching numbers to interrogating variances, you stop treating the gap as inevitable and start treating it as a decision you’re making about your business.
Tools like BAMS exist specifically to make this diagnosis possible, with transparent pricing, next-day funding, and dedicated account managers who can walk you through exactly where every dollar goes between your customer’s card and your bank account. But regardless of your processor, the principle holds: if you can’t explain the gap, you can’t control it. And if you can’t control it, it’s controlling your cash flow.
A useful starting point is running your own daily reconciliation workflow and calculating your actual effective rate against your contracted rate. The number will either confirm you’re on track or reveal exactly how much you’re overpaying.
The Dashboard Is a Scoreboard. Your Bank Account Is the Score.
Dashboards are built to make you feel good. Bank balances are built to tell the truth. The merchants who win are the ones who stop celebrating the scoreboard and start demanding that the score match.
Your revenue isn’t what your platform says you earned. It’s what actually lands in your account, after every fee, hold, and deduction. Know that number. Protect it. Build from it.
Frequently Asked Questions
What is deposit reconciliation in merchant services?
Deposit reconciliation is the process of matching your payment dashboard totals against actual bank deposits to identify and explain any differences. It helps you catch fee errors, unexpected deductions, and timing variances before they compound into significant cash flow problems.
Why does my bank deposit never match my dashboard total?
The gap is caused by processing fees, interchange costs, chargebacks, refunds, and settlement timing delays that reduce your gross sales before funds reach your bank. If the shortfall persists after accounting for known fees and timing windows, it likely signals hidden or bundled charges from your processor.
How do I calculate my effective processing rate?
Divide your total processing fees for a period by your total sales volume for that same period. Compare the result to the rate in your merchant agreement. If there’s a meaningful difference, you’re paying more than you contracted for.


