7 Payment Processor Fees Quietly Draining Your Growth Capital
Last Updated on October 6, 2026 by Dimitri Akhrin
How fee reconciliation uncovers hidden merchant agreement terms that silently reduce your reinvestment funds
Learn which payment processor fees create the gap between your sales dashboard and your bank balance. This guide turns fee reconciliation into a capital recovery exercise, showing you exactly which line items to target and how much you can reclaim.
TL;DR
- Your dashboard shows gross sales; your bank gets the net – The gap is created by interchange fees, assessment fees, chargebacks, refunds, fixed monthly charges, cross-border fees, and settlement timing. Each one operates on its own schedule and deduction method.
- Fee reconciliation is a capital recovery exercise – U.S. merchants paid $187.2 billion in processing fees in 2024, growing nearly 3x faster than transaction volume. Every untracked fee is money you can’t reinvest.
- Reconcile by batch, not by calendar day – Matching daily dashboard sales to daily bank deposits will always produce mismatches. Match each batch submission to its corresponding deposit instead.
- Start with three steps – Switch to batch-level reconciliation, build a fixed-fee calendar for monthly charges, and calculate your effective rate by card type and domestic versus international split. These surface the largest discrepancies first.
- Review your merchant agreement terms semi-annually – Processors can adjust fees with 30 days’ notice. Check your statements in detail every April and October when card network interchange rates change.
Why Your Bank Balance Never Matches Your Dashboard
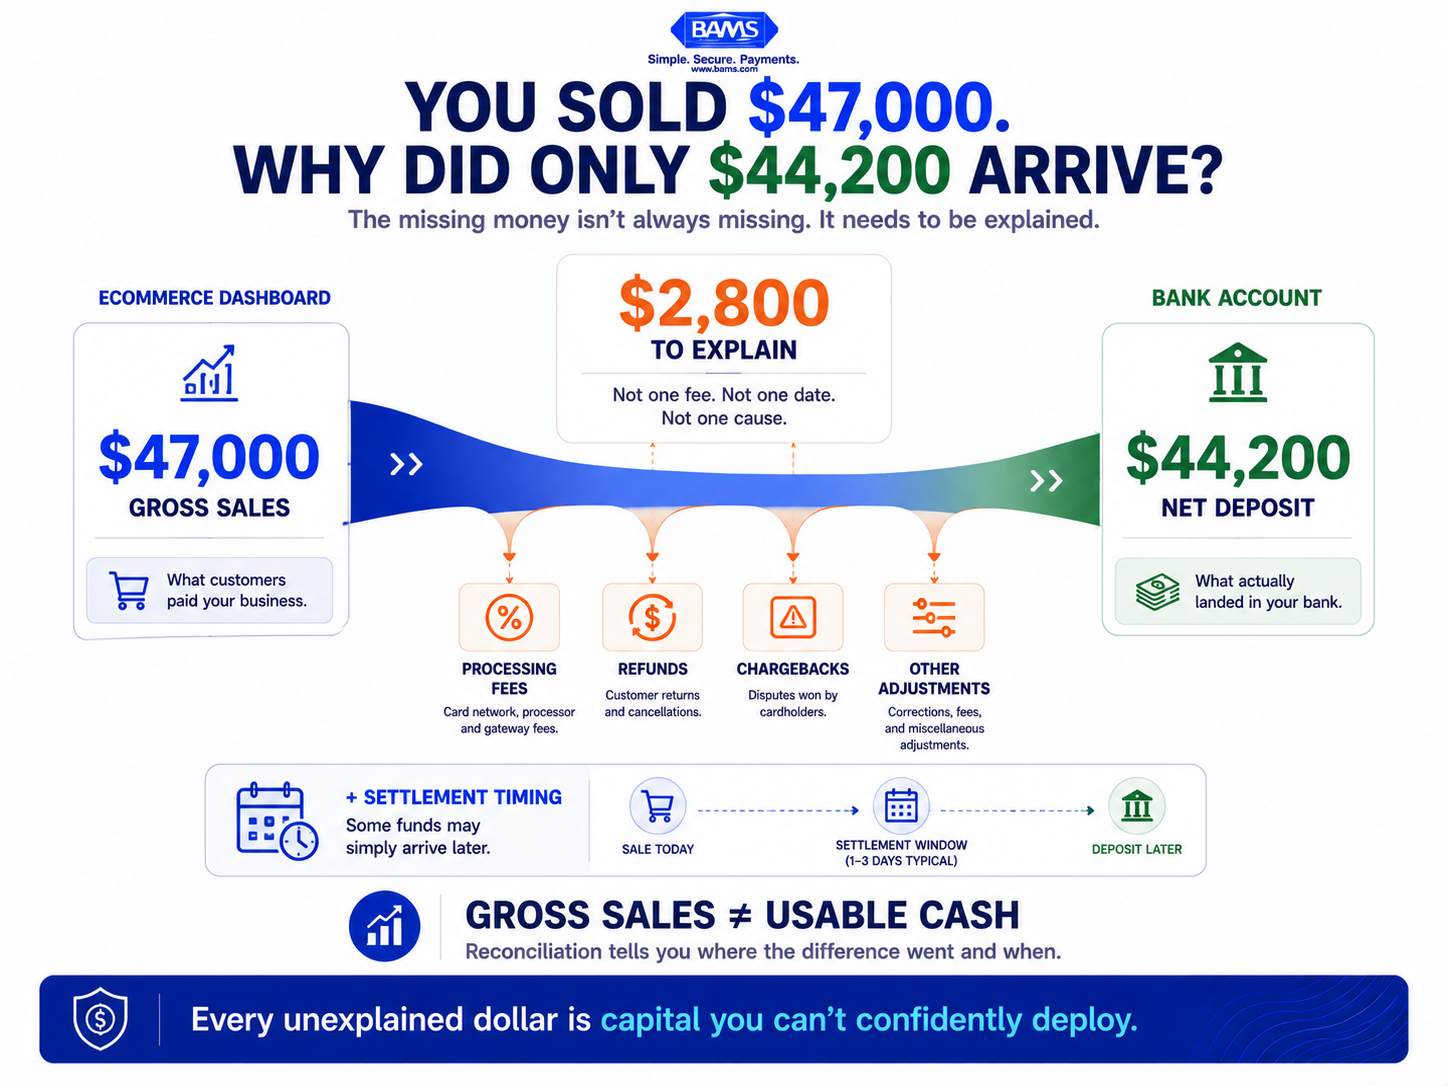
You check your eCommerce dashboard and see $47,000 in sales for the week. Then you check your bank account. The number staring back is $44,200. The difference isn’t a rounding error. It’s a combination of payment processor fees, timing gaps, chargebacks, and line items buried in your merchant agreement terms that you never explicitly approved but agreed to when you signed.
This gap creates a quiet, compounding problem. Every dollar that disappears between your dashboard and your bank is a dollar you can’t reinvest in inventory, ads, or hiring. Payment acceptance involves multiple layers of costs, including interchange and processor fees. Federal Reserve data tracks interchange fees paid to debit card issuers and shows how these costs form part of the economics behind card acceptance. If you aren’t diagnosing where your money goes between “sale” and “deposit,” you don’t have a complete picture of how much revenue is actually available to reinvest.

Your sales dashboard shows what customers paid. Your bank account shows what actually became available to your business. Reconciliation explains the difference.
What This Guide Covers (and What It Doesn’t)
This guide is for eCommerce managers at established online businesses processing enough volume that even a 0.3% discrepancy means thousands per month. You already have a processor. You already accept cards. The question isn’t whether you’re losing money to fees. It’s which fees, how much, and what you can recover.
We’re not covering how to set up a merchant account or choose your first gateway. We’re diagnosing the specific reasons your bank deposits don’t match your sales totals, and turning fee reconciliation from a back-office chore into a capital recovery exercise.
How We Selected These Line Items
Each item below was chosen because it meets two criteria: it commonly creates a gap between dashboard revenue and actual bank deposits, and it’s frequently overlooked in standard monthly reviews. We prioritized fees and timing issues that affect small-to-midsize eCommerce operators specifically, not enterprise-level multi-system architecture problems.
8 Reasons Your Dashboard and Bank Balance Don’t Agree
1. Interchange Fees Vary by Card Type (and You’re Paying the Expensive Ones)
Why it matters: Your dashboard shows gross sales. Your bank receives the net after interchange, which is the fee paid to the card-issuing bank. But interchange isn’t a flat rate. A consumer debit card might cost 0.5%, while a corporate rewards card can exceed 2.8%. If your customer base skews toward premium or business cards, your effective rate climbs without any visible change in your pricing model.
What it looks like today: Interchange isn’t one universal percentage. Visa’s published U.S. interchange reimbursement fee schedule shows that rates vary across transaction and acceptance categories. That means your underlying acceptance cost can shift based on the mix of transactions you’re processing, even when your processor’s advertised pricing appears unchanged. When those costs are bundled into a blended rate, it becomes harder to see which transactions are driving your effective rate higher.
How to apply it: Request an interchange breakdown from your processor (not just a blended rate summary). Compare your effective rate on credit versus debit transactions. If you’re on a blended or tiered model, consider switching to interchange-plus pricing, which separates the interchange cost from the processor’s markup so you can see exactly what you’re paying and why.
2. Assessment Fees from Card Networks Appear Nowhere on Your Dashboard
Why it matters: Visa, Mastercard, and other networks charge assessment fees on top of interchange. These are small percentages (often 0.13% to 0.15%) applied to your total volume, not per transaction. They’re collected by your processor and passed through to the networks. Your dashboard doesn’t show them because they aren’t part of the sale. But they reduce your deposit.
What it looks like today: Assessment fees are typically listed on your monthly statement as separate line items, but many merchants don’t review statements line by line. The UK Payment Systems Regulator noted that processing fees cover authorization, clearing, and settlement services, each with its own cost layer. The same layered structure applies in the U.S.
How to apply it: Pull your last three monthly statements and isolate every line item that isn’t interchange or your processor’s markup. Total them. If assessments plus miscellaneous network fees exceed 0.20% of volume, ask your processor to explain each charge. Some are non-negotiable. Others are processor-added fees labeled to look like network costs.
3. Batch Timing and Settlement Delays Create Phantom Shortfalls
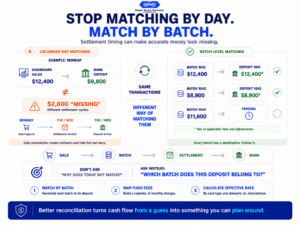
Modern BAMS infographic showing why eCommerce merchants should reconcile processor batches with corresponding bank deposits instead of matching sales and deposits by calendar day.
Why it matters: Your dashboard records a sale the moment a customer pays. Your bank records a deposit one to three business days later (sometimes longer). Over weekends and holidays, this gap widens. If you reconcile daily, you’ll almost always see a mismatch, not because money is missing, but because it hasn’t arrived yet.
What it looks like today: Most processors settle in 24 to 72 hours. But “24 hours” often means one business day after the batch closes, which could be two or three calendar days if a sale happens Friday evening. This timing variance makes it difficult to match dashboard totals to deposits on any given day.
How to apply it: Reconcile by batch, not by calendar day. Match each batch submission to its corresponding deposit rather than trying to align daily sales totals with daily bank activity. If settlement timing is consistently unpredictable, that’s a processor-level issue. Providers like BAMS offer next-day funding specifically to eliminate this timing uncertainty, turning deposit predictability into a cash flow planning tool rather than a guessing game.
4. Chargebacks Deduct from Future Deposits, Not from the Original Transaction
Why it matters: When a customer disputes a charge, the processor pulls the funds from a future deposit, not from the batch that contained the original sale. This means your Tuesday deposit might be short $150 because of a chargeback on a sale from three weeks ago. If you’re only comparing today’s sales to today’s deposit, the numbers will never match.
What it looks like today: Chargeback deductions often appear as a single line item on your deposit statement with a reference number that links back to the original transaction. Many eCommerce managers don’t trace these back, so the shortfall looks unexplained.
How to apply it: Maintain a chargeback log that tracks the original transaction date, the dispute date, and the date the deduction hits your bank. Cross-reference this log during daily reconciliation. Proactive chargeback management and monthly audits reduce the volume of disputes that reach the deduction stage.
5. Refunds Reduce Deposits on a Different Timeline Than the Return
Why it matters: Refunds work like chargebacks in one important way: the deduction from your bank doesn’t happen at the moment you issue the refund. It happens when the processor settles the next batch. If you issue a refund on Wednesday but the deduction appears in Friday’s deposit, your Wednesday and Friday numbers both look wrong.
What it looks like today: Most eCommerce platforms log refunds instantly on the dashboard but the actual fund movement follows the processor’s settlement schedule. This creates a timing mismatch that compounds when you issue multiple refunds across different days.
How to apply it: Tag refunds in your accounting system with both the issue date and the expected settlement date. During reconciliation, match refund deductions to the specific batch they settled in, not the date you clicked “refund” in your platform. This one step eliminates a large percentage of daily reconciliation exceptions.
6. PCI Compliance and Monthly Service Fees Get Buried in Statements
Why it matters: Beyond per-transaction fees, your merchant agreement terms likely include fixed monthly charges: PCI compliance fees, statement fees, gateway fees, and sometimes a monthly minimum fee if your volume drops below a threshold. These fees are deducted from your deposits (or charged separately) and never appear on your sales dashboard.
What it looks like today: A typical small-to-midsize eCommerce merchant might pay $15 to $30 per month in PCI fees, $10 to $25 for a gateway, and $5 to $10 for statement generation. Individually small, these add up to $360 to $780 per year, and they’re often auto-deducted from your first deposit of the month. Default processor settings can add even more charges you never explicitly chose.
How to apply it: Create a fixed-fee calendar that lists every recurring charge, its amount, and the date it’s typically deducted. Compare this calendar to your first-of-month deposits. If you find fees you don’t recognize, call your processor and ask for the specific clause in your agreement that authorizes each one.
7. Currency Conversion and Cross-Border Fees Affect International Sales
Why it matters: If you sell internationally, your dashboard might show a sale in the customer’s local currency converted at one rate, while your processor converts at a different rate and adds a cross-border fee (typically 0.5% to 1.5%). The deposit you receive reflects neither the dashboard amount nor a simple exchange rate calculation.
What it looks like today: International transactions can have a different cost structure from domestic transactions, so looking only at one blended effective rate can hide where additional processing costs are coming from. Segmenting domestic and international transactions separately gives you a clearer view of whether cross-border activity is materially increasing your total acceptance cost.
How to apply it: Segment your transaction data by domestic versus international. Calculate your effective rate for each segment separately. If international transactions cost significantly more, evaluate whether dynamic currency conversion (where the customer pays in their own currency but you receive USD at a known rate) reduces the gap. Review your merchant agreement terms for the exact cross-border fee schedule.
8. Your Processor’s Fee Schedule Changed (and You Missed the Notice)
Why it matters: Most merchant agreements include a clause allowing the processor to adjust fees with 30 days’ written notice, often delivered as a single paragraph buried in a monthly statement or an email with a generic subject line. Merchants paid $1.57 in fees for every $100 in card transactions in 2024. Even a 0.05% increase on a $500,000 annual volume costs you $250 per year, applied silently.
What it looks like today: Fee increases often coincide with semi-annual interchange adjustments from Visa and Mastercard (typically April and October). Processors may pass through the network increase and add their own markup increase at the same time, making it hard to distinguish between the two.
How to apply it: Set a calendar reminder to review your processor statement in detail every April and October. Compare your per-transaction costs month over month. If your effective rate has increased, request a written explanation. Use a merchant services optimization review to benchmark your current costs against what’s available in the market.
The Pattern Behind the Gap
These eight items share a common structure: they all represent money that leaves your revenue stream at a different time, through a different mechanism, or at a different rate than what your dashboard displays. The core issue isn’t that fees exist. It’s that the visibility gap between gross sales and net deposits makes it impossible to plan cash flow accurately.
When you can predict exactly what will land in your bank and when, you can commit to inventory purchases, ad spend, and payroll with confidence instead of holding reserves “just in case.” Fee reconciliation isn’t an accounting exercise. It’s the difference between reactive cash management and strategic reinvestment. The merchants who treat deposit predictability as infrastructure (not overhead) are the ones who can deploy capital faster than competitors operating on the same margins.
Where to Start Without Overwhelming Your Team
You don’t need to fix all eight issues this week. Start with three actions that produce the fastest clarity. First, switch to batch-level reconciliation instead of daily dashboard-to-bank comparisons (item 3). Second, build a fixed-fee calendar to catch monthly deductions before they surprise you (item 6). Third, calculate your effective rate by card type and domestic versus international split (items 1 and 7).
These three steps will surface the largest discrepancies. From there, you can address chargebacks, refund timing, and fee schedule changes as your reconciliation process matures. The goal isn’t perfect accounting on day one. It’s recovering the capital that’s currently invisible so you can put it back to work.
Frequently Asked Questions
What is deposit reconciliation in merchant services?
Deposit reconciliation is the process of matching the sales recorded in your eCommerce platform or payment dashboard to the actual deposits that arrive in your bank account. The goal is to account for every dollar of difference, whether it comes from processing fees, chargebacks, refunds, or settlement timing. Done consistently, it reveals exactly how much revenue you retain after all costs.
Why is timing important in merchant deposit reconciliation?
Settlement timing determines when your processor actually moves funds to your bank. Sales recorded on a Friday might not deposit until Tuesday. If you compare dashboard sales to bank deposits on the same calendar day, you’ll see mismatches that aren’t actually errors. Reconciling by batch (rather than by day) and understanding your processor’s settlement schedule eliminates most timing-related confusion.
How can I optimize my merchant services for better reconciliation?
Start by requesting interchange-plus pricing so you can see the exact cost of each transaction layer. Build a fixed-fee calendar for recurring monthly charges. Segment your transactions by card type and domestic versus international to calculate separate effective rates. These steps make your costs visible, which is the prerequisite for reducing them.
What are common challenges during deposit reconciliation?
The most common challenges are chargebacks deducted from future deposits (not the original transaction batch), refunds settling on a different timeline than when they were issued, monthly fixed fees pulled from deposits without clear labeling, and mid-contract fee increases buried in statement notices. Each of these creates a gap between expected and actual deposits.
How often should I perform deposit reconciliation?
For eCommerce businesses processing meaningful volume, batch-level reconciliation should happen daily or at minimum every time a new deposit arrives. A deeper review of monthly fixed fees, effective rates, and fee schedule changes should happen monthly. Semi-annual reviews in April and October (when card networks adjust interchange rates) catch processor markup increases early.
Which factors affect the timing of merchant service deposits?
Key factors include your processor’s settlement schedule (next-day, two-day, or three-day), the time your daily batch closes, weekends and bank holidays, the card type used (debit often settles faster than credit), and whether the transaction is domestic or cross-border. International transactions and certain high-risk categories may face additional holds.
Sources
- https://www.federalreserve.gov/paymentsystems/regii-average-interchange-fee.htm
- https://usa.visa.com/content/dam/VCOM/download/merchants/visa-usa-interchange-reimbursement-fees.pdf
- https://www.psr.org.uk/media/pcvem3uq/interim-report-market-review-of-scheme-and-processing-fees-may-2024-publication.pdf