Transaction Volume Forecasting: Prevent Processor Holds
Last Updated on October 6, 2026 by Dimitri Akhrin
Build a processor-ready seasonal volume plan that keeps your deposits flowing during peak sales periods
Learn how to build a documented transaction volume forecasting package that prevents payment processor holds during seasonal spikes. This step-by-step tutorial covers baseline calculations, spike projections, and risk-team communication templates.
TL;DR
- Your processor sees spikes as risk, not revenue – A sudden volume increase triggers the same automated flags as fraud or account compromise, leading to holds, reserves, and delayed deposits during your most critical sales period.
- Build a forecast package with 12-month baseline data and weekly projections – Break your spike period into weekly estimates with specific marketing drivers, average ticket sizes, and historical refund rates. Vague “seasonal” labels are not enough.
- Submit your forecast 2 to 4 weeks early and get written confirmation – Send it to your processor’s risk or underwriting team (not general support) and follow up until you receive a written acknowledgment that your volumes are noted and parameters adjusted.
- Sync your marketing calendar with payment operations – Every unplanned flash sale or ad spend increase that isn’t communicated to your processor is a potential account freeze. Treat your forecast as a living document.
- Optimize deposit timing and interchange costs before the spike – Faster settlement (like next-day funding) closes the cash flow gap during peak, and ensuring proper Level 2/3 data submission prevents interchange downgrades on your highest-volume weeks.
What You’ll Achieve: A Processor-Ready Seasonal Volume Plan
By the end of this tutorial, you will have a documented transaction volume forecasting package that you submit to your payment processor before your next seasonal spike. This package includes a rolling 12-month volume baseline, a spike-period projection with supporting evidence, and a communication template your processor’s risk team can act on immediately.
Your success criteria are simple: your processor acknowledges your forecast in writing, your reserve requirements stay unchanged during peak, and your deposits continue without holds. No more scrambling after a freeze. No more explaining why your revenue doubled in a week. You get ahead of the flag instead of reacting to it.
Prerequisites and Setup Checklist
Before you start, gather the following. Missing any of these will slow you down or produce an incomplete forecast.
- 12 months of processing statements showing monthly transaction count and total volume in dollars
- Access to your payment gateway dashboard (Shopify Payments, WooCommerce, Stripe, Authorize.net, or equivalent) with export capability
- A spreadsheet tool such as Google Sheets or Excel
- Your processor’s risk or underwriting contact (email address or direct phone number, not generic support)
- Marketing and promotional calendars for the next 90 days, including planned product launches, flash sales, or ad spend increases
- Last year’s peak-period data broken down by week if available
Time estimate: 3 to 4 hours for the initial build, then 30 minutes per month to maintain. Potential blocker: If you cannot access monthly statement data older than 6 months, contact your processor to request historical records before starting.
Why Transaction Volume Forecasting Prevents Holds and Saves Money
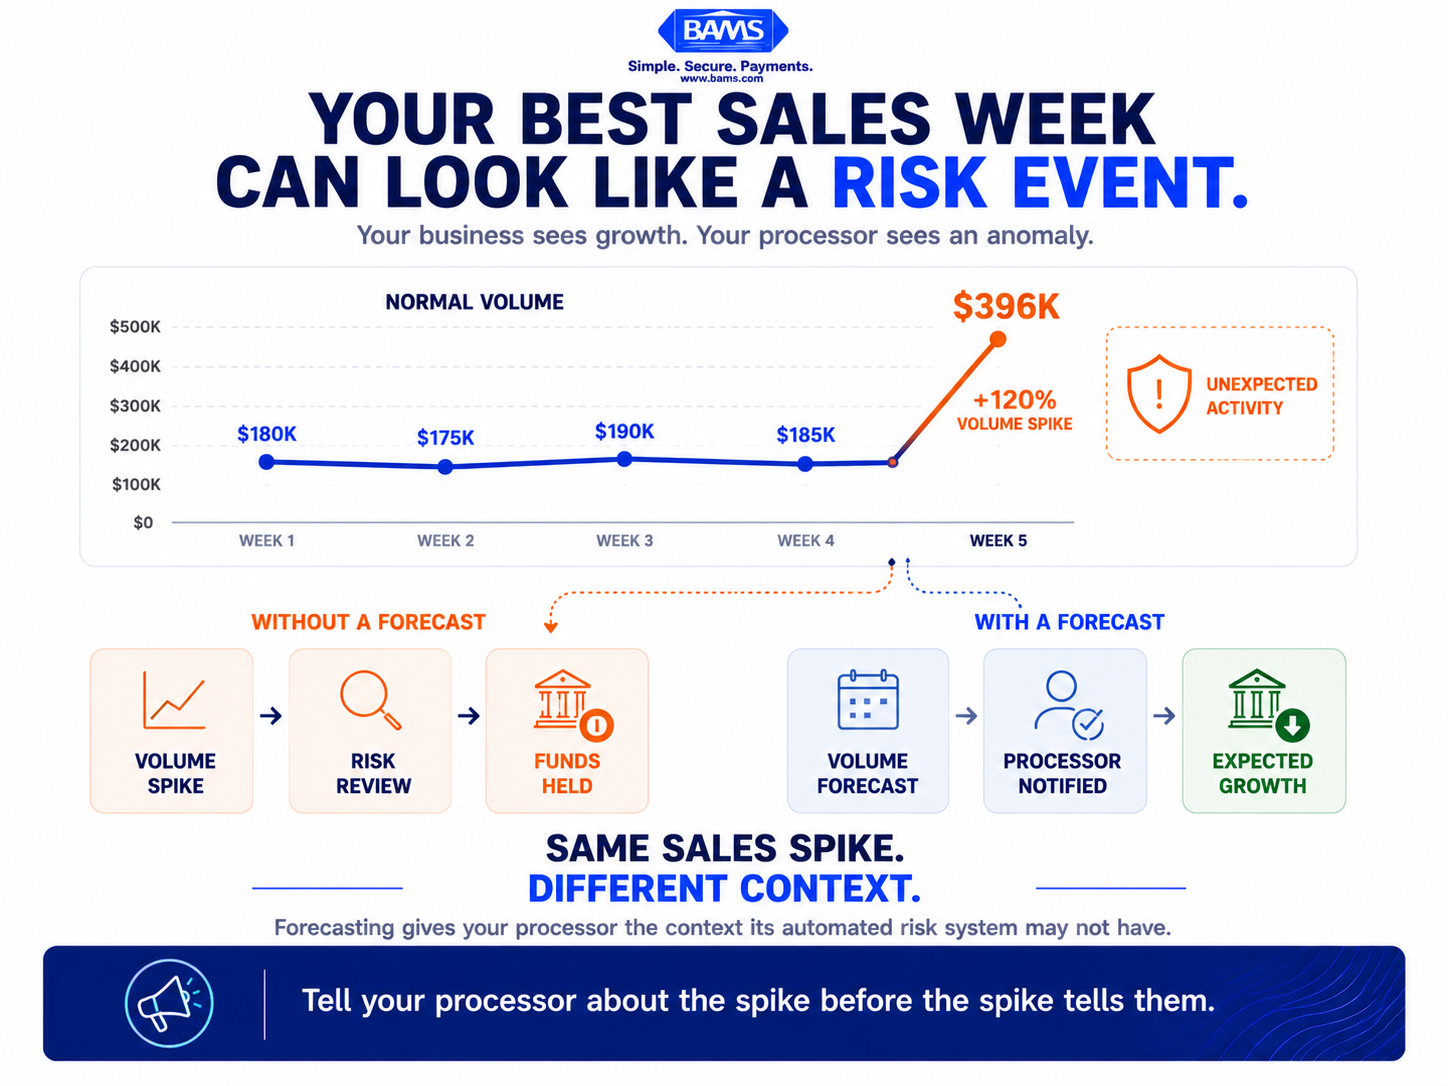
A major sales spike may be good news for your business, but without advance notice, an unusual jump in transaction volume can trigger processor risk controls.
Your processor’s risk model is built to detect anomalies. A sudden 80% spike in weekly volume looks identical to fraud, a compromised account, or a business selling outside its approved category. The model does not know it’s Black Friday for your niche. It only sees deviation from baseline.
When a risk flag triggers, the consequences are immediate: rolling reserves increase, deposit holds extend from one day to five or more, and in severe cases your account gets frozen entirely. These delays hit hardest during the exact window when you need capital to restock inventory and fund shipping. According to the Nilson Report, card-payment transactions are projected to grow 43% over five years (from 776 billion in 2024 to 1.109 trillion by 2029). That growth means risk models are getting more sensitive, not less.
Proactive communication reframes the spike from a red flag into an expected event. This tutorial treats your forecast as a risk-communication tool, not just an internal planning exercise.
Step 1: Export and Organize Your 12-Month Transaction Baseline
Log into your payment gateway dashboard and export monthly transaction data for the past 12 months. You need three columns: month, total transaction count, and total dollar volume. If your gateway only shows daily data, aggregate it by month in your spreadsheet.
Create a new spreadsheet with these headers:
| Month | Transaction Count | Total Volume ($) | Avg Ticket ($) |
|————-|——————-|——————-|—————-|
| Jan 2024 | 4,200 | 189,000 | 45.00 |
| Feb 2024 | 3,800 | 171,000 | 45.00 |
| … | … | … | … |
Calculate your average ticket size by dividing total volume by transaction count for each month. This number matters because a spike in ticket size alongside volume is a separate risk trigger.
Checkpoint: You should have 12 rows of clean data. If any month shows zero or a dramatic anomaly (like a refund batch), add a note explaining it. Your processor will see these same numbers.
Common failure: Gateway exports sometimes split refunds and sales into separate reports. Make sure you’re looking at gross sales volume, not net. If your numbers seem low, check whether refunds were subtracted automatically.
Step 2: Identify Your Seasonal Patterns and Flag the Spike Months
Sort your 12-month data by total volume, highest to lowest. Identify the top 2 to 3 months. These are your historical spike periods. Now calculate the percentage increase each spike month represents over your average monthly volume.
Average Monthly Volume = Sum of all 12 months / 12
Spike Multiplier = Spike Month Volume / Average Monthly Volume
For example, if your average monthly volume is $180,000 and your November volume was $396,000, your spike multiplier is 2.2x. This is the number your processor’s risk team cares about most.
Checkpoint: You should now know your normal range and the magnitude of your seasonal peaks. If your spike multiplier exceeds 2x, your forecast becomes especially critical because most processors flag volume increases above 100% of baseline.
Common failure: Businesses with only one year of data sometimes mistake a one-time event (a viral product, a PR mention) for a seasonal pattern. Cross-reference spikes with your marketing calendar to confirm they are repeatable.
Step 3: Build Your Forward-Looking Volume Projection

A processor-ready forecast turns an unexplained volume spike into documented, expected growth.
This is where you move from historical analysis to a forecast your processor can use. Create a new tab in your spreadsheet labeled “Projected Volume” with these columns:
| Week Starting | Projected Tx Count | Projected Volume ($) | Projected Avg Ticket | Driver/Reason |
|—————|———————|———————-|———————-|—————————-|
| Nov 18 | 2,800 | 140,000 | 50.00 | Black Friday email launch |
| Nov 25 | 5,600 | 280,000 | 50.00 | Black Friday + Cyber Monday|
| Dec 2 | 4,200 | 210,000 | 50.00 | Extended holiday sale |
Break your spike period into weekly projections, not monthly. Processors evaluate risk on shorter windows. A monthly projection that says “$500K in November” hides the fact that $350K of it lands in one week.
In the “Driver/Reason” column, type the specific marketing action or external event causing each projected increase. This is the evidence your processor needs. Vague entries like “seasonal” are not enough. Write “Paid Meta campaign launching Nov 15 with $20K ad spend” or “Annual warehouse clearance sale, email to 85K subscribers.”
Checkpoint: Your projection should cover every week in the spike window, with a clear reason for each volume increase. If you cannot explain the spike, your processor won’t trust it either.
Step 4: Document Your Average Ticket Size and Refund Expectations
Processors flag two things independently: volume spikes and ticket-size changes. If your average ticket normally sits at $45 but your holiday bundles push it to $120, that’s a separate risk signal. Add a row to your projection showing expected average ticket size per week.
Also calculate your historical refund rate for spike periods. Pull refund data from your gateway for last year’s peak months and express it as a percentage of total transactions.
Refund Rate = (Refund Transactions / Total Transactions) x 100
Include this in your forecast package. A processor seeing a 2.2x volume spike with a note saying “historical refund rate during peak is 3.1%, consistent with off-peak rate of 2.8%” has far less reason to intervene than one seeing the spike alone.
Common failure: Forgetting to account for post-peak refund surges. If your January refund rate historically jumps to 8% after holiday sales, include that too. Surprise refund spikes trigger chargeback-related holds. Understanding these patterns also connects to how transaction downgrades and hidden statement costs quietly inflate your effective rates during these periods.
Step 5: Draft Your Processor Communication Letter
Write a formal notification to your processor’s risk or underwriting team. Do not send this to general support. Use the template below, replacing bracketed values with your data:
Subject: Seasonal Volume Forecast – [Your Business Name] – MID [Your Merchant ID]
Dear [Risk/Underwriting Contact],
I’m writing to provide advance notice of anticipated volume increases
for our account during [date range].
Our trailing 12-month average monthly volume is $[X] across [X] transactions,
with an average ticket of $[X].
During [spike period], we project the following weekly volumes:
– Week of [date]: $[X] ([X] transactions, avg ticket $[X])
– Week of [date]: $[X] ([X] transactions, avg ticket $[X])
– Week of [date]: $[X] ([X] transactions, avg ticket $[X])
These increases are driven by:
– [Specific marketing action 1]
– [Specific marketing action 2]
Our historical refund rate during comparable periods is [X]%.
Our current chargeback ratio is [X]%.
Please confirm receipt and let us know if additional documentation
is needed to keep our account in good standing during this period.
Best regards,
[Your Name]
[Your Title]
[Business Name]
Checkpoint: Before sending, verify your merchant ID is correct and your chargeback ratio is current. You can pull your chargeback ratio from your most recent processor statement or dashboard.
Common failure: Sending the letter too late. Processors need 2 to 4 weeks to adjust risk parameters. If your spike starts November 25, send this by November 1 at the latest.
Step 6: Request Written Confirmation and Adjusted Limits
Do not treat a lack of response as approval. Follow up within 5 business days if you haven’t received a written acknowledgment. You need a reply that confirms one of the following:
- Your projected volumes are within acceptable parameters and no action is needed
- Your processing limits have been temporarily increased for the specified period
- Additional documentation is required (and what exactly they need)
Save this confirmation. If a hold or reserve is applied during your spike despite prior notification, this email becomes your evidence for escalation.
Common failure: Accepting a verbal “you’re fine” from a support agent. Verbal confirmations carry no weight when the automated risk system flags your account at 2 AM on Black Friday. Get it in writing from the risk or underwriting team specifically.
Step 7: Align Your Payment Processing Strategies With Your Promotional Calendar
Your forecast is only accurate if your marketing team and your payment operations are synchronized. Create a shared calendar (Google Calendar, Notion, or a simple shared spreadsheet) that maps every planned promotion, product launch, or ad spend increase to its expected transaction impact.
For each event, log:
- Event name and date
- Expected traffic increase (percentage or absolute visitors)
- Expected conversion rate (use your historical rate unless the offer is significantly different)
- Projected additional transactions and volume
This calendar becomes your living forecast. When marketing adds a flash sale that wasn’t in the original plan, you update the forecast and notify your processor again. This is where many eCommerce managers lose control: the original forecast was accurate, but an unplanned promotion pushed volume 40% beyond even the projected spike.
If you work with a merchant services partner like BAMS, their dedicated account managers can help coordinate these updates directly with underwriting, which removes the guesswork of figuring out who to contact and what format they need.
Step 8: Optimize Your Deposit Timing Before the Spike
Even if your processor doesn’t flag your account, standard 2 to 3 day deposit windows create a cash flow gap during peak season. You’re shipping inventory today with money that won’t arrive until Thursday. Over a high-volume week, that gap can represent tens of thousands of dollars in unavailable capital.
Payment speed can have a direct operational impact on working capital. Mastercard’s 2025 research on commercial card acceptance found that businesses accepting cards reported benefits including faster receipt of funds, greater payment visibility, and improved processing efficiency. During a seasonal surge, those advantages become especially important because more cash is moving through the business at once.
Check your current deposit schedule in your processor dashboard or contract. If you’re on T+2 or T+3 settlement, contact your processor before peak season to ask about faster options. Next-day funding, for example, closes this gap almost entirely and gives you access to yesterday’s sales revenue by the following business day.
This is particularly relevant during seasonal spikes because your highest-expense period (inventory restocking, shipping costs, ad spend) often coincides with your highest-revenue period. Delayed access to funds during this window can tighten working capital and make it harder to restock or cover other near-term expenses. The Federal Reserve’s FedNow Service reflects the broader shift toward faster payments, enabling participating financial institutions to send and receive payments within seconds, 24 hours a day, seven days a week. Ask your processor what faster funding options are available to you.
Configuration and Customization: Adjusting Your Forecast for Your Business
Variables You Should Adjust
- Forecast granularity: If your spikes are concentrated in 2 to 3 days (like a 48-hour flash sale), break your projection into daily estimates instead of weekly. The more precise your forecast, the more credible it is to the risk team.
- Channel breakdown: If you sell through multiple channels (website, marketplace, in-store), separate your projections by channel. A processor may have different risk thresholds for card-present versus card-not-present transactions.
- New product launches: If your spike includes a new product category or a significantly higher price point, flag this explicitly. A business approved for $50 average tickets selling a $500 bundle for the first time will trigger a review regardless of volume.
Safe Defaults vs. Must-Change Settings
Safe default: Using last year’s spike multiplier as your baseline projection. Must change: If you’ve significantly increased ad spend, added new sales channels, or expanded your product catalog, last year’s numbers will underestimate your spike. Apply a growth factor based on your year-over-year trend.
Also review whether your interchange qualification is optimized. If you’re processing high volumes without passing Level 2 and Level 3 data, you may be paying elevated interchange rates on every transaction during your busiest period. Learn more about how transaction reporting cuts payment processing costs through proper data submission.
Verification and Testing: Confirm Your Forecast Package Works
Run this verification checklist before submitting your forecast:
- Does your 12-month baseline match your processor statements within 5%? Cross-check at least 3 months.
- Does every projected spike week have a documented driver in the “Reason” column?
- Is your average ticket projection realistic? Compare it to your current product mix and any planned bundles or upsells.
- Have you included your refund rate and chargeback ratio?
- Is your communication letter addressed to the correct department (risk or underwriting, not general support)?
- Are you submitting at least 2 weeks before the spike begins?
Success definition: You receive a written response from your processor confirming that your projected volumes are noted and your account parameters are adjusted (or confirmed as sufficient). During the spike period, your deposits continue on schedule with no new holds or reserve increases.
After the spike, compare your actual volume to your projection. If you were within 15%, your forecasting method is solid. If you were off by more than 30%, investigate which assumptions failed and adjust for next cycle.
Common Errors and Fixes
Error: “Account placed on reserve” during peak week
Symptom: You see a percentage of daily volume withheld in your deposit report. Cause: Your processor’s automated risk system flagged the volume increase despite your notification. This often happens when the notification went to the wrong department or wasn’t logged in their system. Fix: Forward your original notification and the written confirmation to your processor’s risk team immediately. Request a manual review and release of the reserve within 24 hours.
Error: Deposits delayed from T+1 to T+3 without notice
Symptom: Your normal next-day deposits slow to 2 or 3 business days. Cause: Volume exceeded your approved processing cap, triggering an automatic settlement delay. Fix: Contact your processor with your forecast showing the projected volume. Request a temporary cap increase. For future spikes, request the cap increase in your initial notification letter.
Error: Forecast significantly underestimates actual volume
Symptom: Actual volume exceeds projection by 50% or more. Cause: An unplanned promotion, viral social media moment, or competitor stockout drove unexpected traffic. Fix: Send an updated forecast to your processor as soon as you see volume trending above projection. Even a same-day email saying “we’re tracking 60% above forecast due to [reason]” is better than silence. Include real-time data from your gateway dashboard.
Error: Processor asks for documentation you don’t have
Symptom: Risk team requests bank statements, supplier invoices, or fulfillment records. Cause: Your account is newer or your projected spike is large enough to require enhanced due diligence. Fix: Prepare a supplemental folder with your last 3 months of bank statements, a sample supplier invoice, and a screenshot of your shipping dashboard showing fulfillment rates. Having this ready before the request saves days.
Seasonal Volume Optimization: Next Steps and Extensions
Once your forecast process is established, extend it in these directions:
- Automate your baseline tracking. Set up a monthly recurring export from your gateway and feed it into your spreadsheet automatically using Zapier, Google Sheets integrations, or your platform’s API. This keeps your 12-month rolling average current without manual work.
- Layer in interchange optimization. Peak season is when interchange costs compound fastest. Review whether your gateway is passing Level 2 and Level 3 data fields correctly to avoid downgrades on high-volume weeks.
- Build a post-peak review process. After each spike, compare projected versus actual volume, document any processor friction (holds, delays, reserve changes), and adjust your next forecast accordingly. This creates a compounding advantage: each cycle, your forecasts get more accurate and your processor relationship gets stronger.
Your payment processing strategies should evolve with your business. A forecast that worked when you processed $150K per month needs recalibration when you’re processing $400K. Treat this as a living document, not a one-time exercise.
Frequently Asked Questions
What is a seasonal volume playbook in merchant services optimization?
A seasonal volume playbook is a documented plan that includes your historical transaction baseline, projected spike-period volumes broken down by week, the marketing drivers behind each increase, and a communication template for your processor’s risk team. It functions as both an internal planning tool and an external risk-communication package that prevents account holds during high-volume periods.
When should businesses review their payment processing setup before peak seasons?
Start at least 6 weeks before your projected spike. You need 2 to 3 weeks to gather data and build your forecast, then at least 2 to 4 weeks of lead time for your processor to review and adjust risk parameters. For most eCommerce businesses with a Q4 peak, this means beginning the review process in early September.
How can businesses use data to forecast transaction volume for seasonal planning?
Export 12 months of transaction data from your payment gateway, calculate your average monthly volume and average ticket size, then identify historical spike months and their multipliers relative to your baseline. Layer in planned marketing activities (ad spend increases, email campaigns, product launches) to project weekly volumes during the upcoming spike period. Each projection should be tied to a specific, documented driver.
Why do payment processors flag seasonal volume spikes?
Processor risk models are designed to detect anomalies that correlate with fraud, account compromise, or unauthorized business activity. A sudden doubling of volume looks statistically identical to these threats. The model cannot distinguish between a legitimate Black Friday surge and a compromised account. Pre-communicating your forecast with evidence gives the risk team context the automated system lacks.
How can payment processors optimize their services for seasonal fluctuations in volume?
Processors can temporarily raise approved volume caps, adjust risk-scoring thresholds for pre-notified accounts, and offer faster settlement options like next-day funding during peak periods. The key is that these adjustments require advance notice and documentation from the merchant. Processors rarely make proactive adjustments without a formal request.
Which strategies can help manage peak retail season effectively from a payments perspective?
The most effective strategies include submitting a documented volume forecast to your processor 2 to 4 weeks in advance, requesting temporary cap increases, securing next-day funding to close cash flow gaps, ensuring your gateway passes Level 2 and Level 3 data to avoid interchange downgrades on high-volume weeks, and maintaining a shared calendar between marketing and payment operations so unplanned promotions don’t blindside your processor.