Turning Faster Deposits into a Growth Lever
Last Updated on September 15, 2026 by Dimitri Akhrin
Five signals your payment setup is quietly draining cash you could be reinvesting this week.
Examines funding delays and fee opacity as compounding cash flow drains rather than isolated line items, contrasting what operators typically see on statements versus what their money is actually doin
TL;DR
- Deposit delays trap working capital – If your funds take 3+ business days to arrive, tens of thousands of dollars sit unavailable for reinvestment at any given time. Next-day funding options exist for most SMB merchants.
- Opaque pricing hides overcharges – Flat-rate and tiered models bundle costs so you cannot see where you are overpaying. Interchange-plus pricing gives you line-item visibility and a basis for negotiation.
- Chargebacks cost far more than the refund – Dispute fees, lost inventory, and elevated risk profiles compound quickly. Proactive prevention (alerts, clear descriptors, fast resolution) saves thousands annually.
- Batch timing mismatches silently add deposit days – If your gateway batches after your processor’s cutoff, every late transaction waits an extra day. Aligning these settings is a free fix.
- Annual processor reviews pay for themselves – Interchange rates shift twice a year and processor markups creep upward. A 12-month-old agreement is almost certainly no longer competitive.
Your Payment Setup Is Quietly Draining Cash You Could Reinvest This Week
Most eCommerce operators check their processing statements once a month, scan the total fees line, and move on. That habit hides a compounding problem. The gap between when a customer pays and when that money actually lands in your account is not idle time. It is time your cash is unavailable for inventory, ad spend, payroll, or any other lever that drives growth.
Effective cash flow management requires looking beyond the rate on your statement. U.S. banks collected nearly $66 billion in interchange fees in 2025, up from $64 billion in 2024. But the fee line is only one drain. Deposit timing, pricing opacity, chargeback losses, and batch submission habits each siphon working capital in ways that rarely appear on a single report.
This piece identifies five specific signals that your payment infrastructure is costing more than it should, and what to do about each one this week.
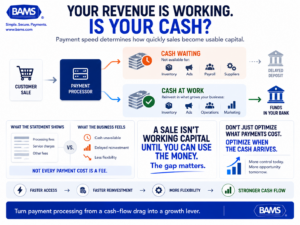
Revenue only becomes useful when it is available to deploy. Faster, more predictable deposits can shorten the gap between making a sale and putting that money back into growth.
Who This Is For and What It Covers
This is for ecommerce managers at established online businesses (roughly 10 to 50 employees) who process enough monthly volume that small inefficiencies compound into real money. If you are running six figures or more per month through card processing and feel like your margins are tighter than your revenue growth should allow, these signals are worth auditing.
This is not a guide to enterprise payment orchestration or tokenization strategy. It focuses on five operational signals you can identify and act on without a dedicated payments team, using tools and changes available to SMB merchants right now.
How These Five Signals Were Selected
Each signal meets three criteria: it is commonly invisible on standard merchant statements, it compounds over time rather than appearing as a one-time cost, and it can be addressed within a week by an ecommerce operator without rebuilding their tech stack. The focus is on the gap between what you see on paper and what your money is actually doing between sale and deposit.
5 Signals Your Payment Setup Is Quietly Draining Cash Flow
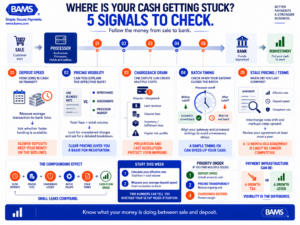
Payment inefficiencies rarely appear as one obvious cost. Slow deposits, unclear pricing, chargebacks, misaligned batches and outdated agreements can quietly combine into a much larger cash-flow drag.
1. Your Deposits Take Three or More Business Days to Arrive
Why it matters: A two-day deposit delay on $500,000 in monthly revenue means roughly $33,000 is perpetually in transit, unavailable for reinvestment. Over a year, that is $33,000 you can never deploy toward inventory purchases, paid media, or supplier discounts that require immediate payment. Most operators treat deposit speed as fixed. It is not.
What it looks like today: Many legacy processors and aggregated platforms batch-settle on a T+2 or T+3 schedule. Some hold funds even longer for merchants flagged as higher risk. Meanwhile, next-day and same-day funding options exist for SMB merchants, but they are rarely the default. You have to ask, or switch.
How to apply it: Pull your last 30 days of deposits. Calculate the average number of business days between transaction and bank arrival. If it is above 1.5 days, contact your processor about next-day funding eligibility. Compare the cost of accelerated funding against the return you would get from deploying that cash a day earlier into your highest-ROI channel.
2. You Cannot Break Down Your Effective Rate by Card Type
Why it matters: Payment processing fees are not a single number. Interchange rates vary by card brand, card type (rewards, corporate, debit), and transaction method. If your statement shows one blended rate, you have no way to identify which transactions cost the most or where savings exist. Visa explains that merchants negotiate and pay a merchant discount to their financial institution, which may include multiple processing services. Opaque pricing models can make those individual cost components harder to identify.
What it looks like today: Tiered and flat-rate pricing models obscure your true cost. An interchange-plus (cost-plus) pricing structure separates the wholesale interchange cost from the processor’s markup, giving you line-item visibility. This is not a new concept, but many growing eCommerce brands still operate on the flat-rate model they signed up for at launch.
How to apply it: Request an interchange qualification report from your processor. If they cannot provide one, that is your answer. Compare your effective rate (total fees divided by total volume) against your merchant agreement and the applicable published interchange categories. If your effective rate is higher than expected, investigate the transaction mix, qualification categories, and processor markup before assuming volume is the cause.
3. Chargebacks Are Treated as a Cost of Doing Business
Why it matters: A chargeback does not just cost you the transaction amount. It adds a fee (typically $15 to $100 per dispute), removes the product from your inventory, and increases your risk profile with your processor. Elevated chargeback ratios can trigger monitoring programs, reserve holds, or account termination. Yet most eCommerce operators only react to chargebacks after they appear on a statement.
What it looks like today: Proactive chargeback defense uses alert networks and real-time notifications to resolve disputes before they become formal chargebacks. Services like BAMS pair chargeback prevention tools with dedicated account managers who flag emerging patterns, helping merchants address the root cause (shipping delays, unclear billing descriptors, subscription confusion) rather than just absorbing the loss.
How to apply it: Calculate your chargeback ratio for the last 90 days (total chargebacks divided by total transactions). If it is above 0.5%, audit your top three dispute reasons. Update billing descriptors, tighten refund policies, and ask your processor whether they offer chargeback alerts or pre-dispute resolution. Preventing one chargeback per week at a $75 average order value saves over $3,900 annually before fees.
4. You Have No Idea When Your Daily Batch Submits
Why it matters: Most processors have a daily cutoff time for batch settlement. Transactions processed after that cutoff roll into the next business day’s batch, adding 24 hours (or more, over weekends) to your deposit timeline. If your platform auto-batches at 11 PM but your processor’s cutoff is 5 PM, every evening sale sits an extra day.
What it looks like today: Batch submission timing is a setting, not a law of physics. Many payment gateways allow you to configure when batches close. Some processors offer multiple daily settlement windows. But this is rarely discussed during onboarding and almost never revisited after setup. The result is that deposit delays quietly trap cash flow in ways that never appear as a fee on your statement.
How to apply it: Log into your gateway dashboard and find your batch settlement schedule. Compare it against your processor’s published cutoff time. If there is a mismatch, adjust your batch close to align with (or precede) the cutoff. For weekend-heavy businesses, ask whether your processor offers weekend settlement or if Friday evening transactions sit until Monday.
5. You Have Not Compared Your Transparent Pricing in Over a Year
Why it matters: Card network fees shift every April and October. Processor markups creep upward through rate increases buried in amendment notices. If you have not reviewed your processing agreement in the last 12 months, you are almost certainly paying more than you were when you signed. Research from the UK Payment Systems Regulator found card scheme and processing fees rose more than 25% in real terms over a four-year span, and U.S. merchants face similar structural pressure.
What it looks like today: Some merchants processing $20,000 per month have saved over $3,300 annually by switching from a flat 2.9% rate to a transparent pricing model with lower effective costs. The savings scale with volume. Yet many operators avoid the comparison because switching processors feels disruptive. In practice, most migrations take days, not months.
How to apply it: Pull your last three monthly statements. Calculate your effective rate and total fees. Request a cost comparison from at least one processor that offers interchange-plus pricing with transparent pricing and next-day funding. Focus on three numbers: effective rate, average deposit speed, and monthly chargeback costs. If any one of those improves meaningfully, the switch pays for itself.
The Pattern Behind These Five Signals
Each of these signals shares a common trait: the cost is real, but it never shows up as a single alarming line item. Deposit delays do not appear as fees. Batch timing mismatches are invisible. Opaque pricing makes overcharges undetectable. Chargebacks are written off as inevitable. Stale agreements go unreviewed because “it’s working.”
Together, these drains compound. A business losing $280 per month to pricing opacity, $3,900 per year to preventable chargebacks, and $33,000 in perpetually trapped working capital from slow deposits is not facing one problem. It is funding a system designed to benefit the processor, not the merchant. The shift is not about finding one fix. It is about recognizing that your payment infrastructure is either a growth lever or a growth tax, and the difference is visibility.
Where to Start This Week
You do not need to overhaul your entire payment stack at once. Start with the signal that is easiest to measure: pull your last statement, calculate your effective rate, and check your average deposit speed. Those two numbers tell you whether your current setup is competitive or costing you.
If you find two or more of these signals in your current setup, prioritize deposit speed first (it unlocks capital immediately), then pricing transparency (it reduces ongoing costs), then chargeback prevention (it protects margin over time). Each change is independent. You can act on one without touching the others. The goal is not perfection. It is making sure your payments work for your business instead of quietly working against it.
Frequently Asked Questions
How can ecommerce businesses optimize payment processing to reduce declines?
Start by reviewing your authorization rate in your gateway dashboard. Common causes of unnecessary declines include mismatched AVS settings, overly aggressive fraud filters, and expired card-on-file data for subscriptions. Adjusting fraud thresholds and enabling automatic card updater services can recover 2% to 5% of declined transactions without increasing risk.
When should merchants conduct a payment processing audit?
At minimum, review your processing costs and deposit timing every 12 months. Card network interchange rates update in April and October, and processors frequently adjust markups through contract amendments. If your monthly volume has changed significantly (up or down), an audit is especially valuable because your rate tier or risk classification may have shifted.
Which factors affect the speed of payment deposits?
Three main factors determine deposit speed: your processor’s settlement schedule (next-day vs. T+2 or T+3), your batch submission timing relative to the processor’s daily cutoff, and your merchant risk classification. Weekend and holiday schedules also play a role. Asking your processor about next-day funding eligibility is the fastest way to identify whether faster deposits are available to you.
What is interchange-plus pricing and why does it matter for cash flow management?
Interchange-plus pricing separates the wholesale cost set by card networks (interchange) from your processor’s markup. This gives you line-item visibility into what you are actually paying and where savings exist. Flat-rate and tiered models bundle these costs together, making it difficult to identify overcharges or negotiate better terms as your volume grows.
How do chargebacks impact eCommerce businesses beyond the refund amount?
Each chargeback typically carries a fee of $15 to $100 on top of the lost transaction amount. High chargeback ratios (above 1%) can trigger monitoring programs from card networks, leading to reserve holds, higher processing rates, or account termination. Proactive prevention through alerts, clear billing descriptors, and responsive customer service is significantly cheaper than absorbing disputes after the fact.
Why is payment optimization important for growing eCommerce brands?
As transaction volume grows, small inefficiencies compound. A 0.5% difference in effective processing rate on $500,000 in monthly volume equals $2,500 per month, or $30,000 per year. Combined with deposit delays and chargeback losses, payment infrastructure that was “good enough” at launch can become one of your largest controllable costs as you scale.
Sources
- https://www.stlouisfed.org/on-the-economy/2026/apr/banking-analytics-credit-debit-card-fees-collected-banks-rose-2025
- https://usa.visa.com/support/small-business/regulations-fees.html
- https://usa.visa.com/content/dam/VCOM/download/merchants/visa-usa-interchange-reimbursement-fees.pdf
- https://www.psr.org.uk/media/sogjjvl4/mr22-110-card-sp-fees-mr-final-report-publication-redacted-mar-2025-updated.pdf