Daily Deposit Forecasting for eCommerce: Turn Faster Funding Into Growth
How daily deposit timing transforms inventory reinvestment speed during peak selling windows
Learn how to build rolling cash flow forecasts calibrated to daily deposits, connect forecasting to real-time inventory reinvestment decisions, and avoid common mistakes when revenue moves fast.
TL;DR
- Daily deposits demand daily forecasting – Getting paid every day increases decision frequency, not just cash availability. Without a daily forecast, you’ll either sit on idle cash or spend reactively.
- Build a rolling 30-day forecast from net deposits, not gross sales – Your actual available cash is gross revenue minus processing fees, chargebacks, and holds. Use 60 to 90 days of deposit history to establish your baseline.
- Map outflows daily to find reinvestment windows – Overlay your fixed and variable costs on a daily grid against projected deposits. The surplus above your minimum cash buffer is what you can deploy into inventory, ads, or supplier discounts.
- Stress-test before peak selling periods – Run conservative, expected, and aggressive scenarios through your forecast before any major promotion or seasonal spike. Pre-position inventory and set ad budget caps based on the numbers, not instinct.
- Recalibrate weekly to improve accuracy over time – Compare projected vs. actual balances every week, identify variance patterns, and adjust your model. A forecast that improves each month becomes your most reliable decision-making tool.
Guide Orientation: What This Covers and Who It’s For
This guide is built for eCommerce managers at established online businesses who receive daily or next-day deposits from their payment processor and need a reliable method for forecasting cash flow in that environment. If you’re operating on a 3 to 5 day deposit cycle, the principles here still apply, but the real value unlocks when your revenue lands daily.
By the end, you’ll understand how to build a rolling cash flow forecast calibrated to daily deposit timing, how to connect that forecast to inventory reinvestment decisions during peak selling windows, and how to avoid the most common forecasting mistakes eCommerce operators make when cash moves fast.
This guide does not cover general invoicing practices, B2B receivables management, or accounting software selection. It focuses specifically on cash flow acceleration strategies as they relate to deposit timing, inventory positioning, and reinvestment speed for eCommerce operations.
Why Cash Flow Forecasting Changes When You Get Paid Daily
Most cash flow advice assumes a lag between earning revenue and accessing it. For eCommerce operators on standard 3 to 5 day deposit cycles, that assumption holds: you sell on Monday, and you might not see those funds until Thursday or Friday. Forecasting in that world is about bridging gaps and managing uncertainty.
Daily deposits change the game entirely. When revenue from today’s sales lands in your account tomorrow morning (or the same day), the forecasting challenge shifts. You’re no longer predicting when money arrives. You’re deciding what to do with money that’s already there, often before your competitors on slower cycles have even received theirs.
Federal Reserve Small Business Survey data continues to show that liquidity management and working capital access remain major operational concerns for growing businesses. Ecommerce operators who shorten the gap between sales and usable cash gain a measurable advantage in inventory and advertising responsiveness.
The cost of not adapting your forecasting to daily deposits is subtle but compounding. You either sit on cash you could be deploying (opportunity cost) or you spend reactively without a framework (risk of overextension). Neither outcome serves a growing eCommerce operation. The operators who win are the ones who treat deposit timing as a strategic variable, not a back-office detail.

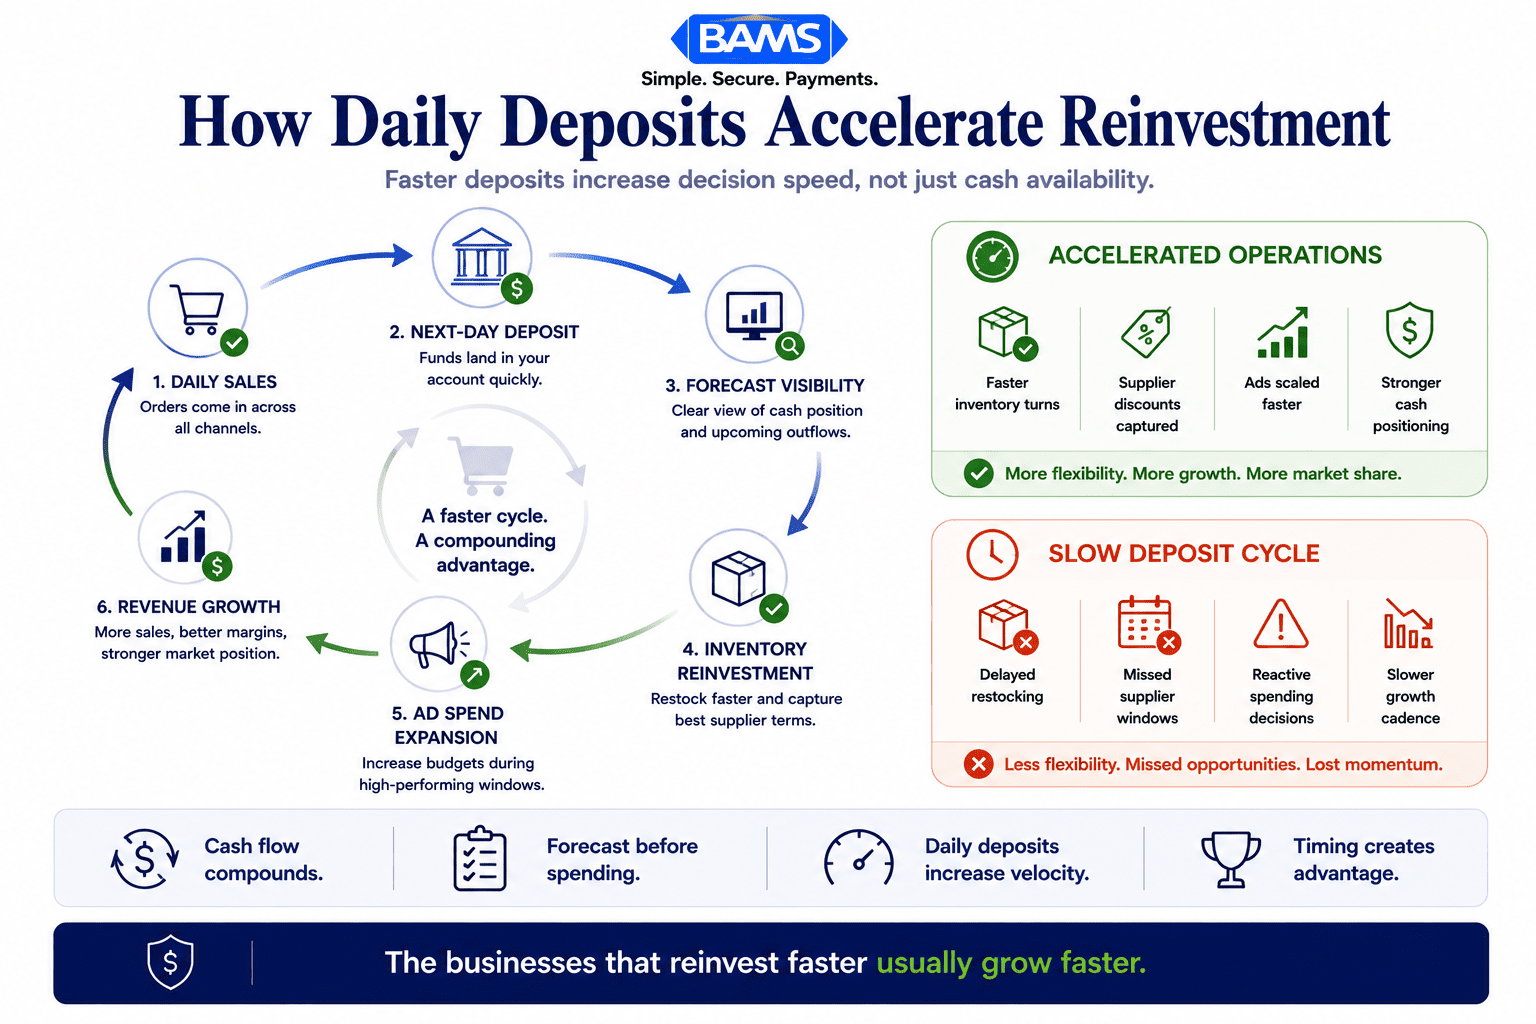
Daily deposits do not just improve liquidity. They increase how quickly eCommerce businesses can reinvest revenue back into growth.
Core Concepts: The Language of Daily Cash Flow Forecasting
Cash Conversion Cycle vs. Deposit Cycle
The cash conversion cycle (CCC) measures how long it takes from spending money on inventory to receiving cash from selling that inventory. Your deposit cycle is one component of CCC: it’s the gap between a customer paying you and those funds hitting your bank account. Shortening the deposit cycle compresses the entire CCC, freeing capital faster.
Rolling Forecast vs. Static Forecast
A static forecast projects cash flow for a fixed period (say, the quarter) and stays put. A rolling forecast updates continuously, adding new days or weeks as old ones pass. For daily deposits, rolling forecasts are essential because your cash position changes every 24 hours. Static models can’t keep up.
Reinvestment Velocity
This is the speed at which you can take revenue from a sale and redeploy it into inventory, advertising, or operations. Daily deposits increase your maximum reinvestment velocity. But velocity without direction is just chaos. The forecast is what provides direction.
The Misconception About “More Cash, Fewer Problems”
Getting paid daily does not automatically improve cash flow management. It increases the frequency of decisions you need to make. Without a forecasting system, daily deposits can actually create more confusion: more line items, more micro-decisions, and more temptation to spend reactively.
Getting paid daily does not automatically improve cash flow management. It increases the frequency of decisions you need to make. Without a forecasting system, daily deposits can actually create more confusion: more line items, more micro-decisions, and more temptation to spend reactively. Modern Treasury payment operations resources continue to emphasize the importance of real-time visibility and operational forecasting in high-frequency payment environments.
The Framework: A Four-Phase Forecasting System for Daily Deposits
Forecasting cash flow on a daily deposit cycle follows four interconnected phases. Each phase builds on the one before it, and the system cycles continuously rather than running once per quarter.
- Phase 1: Capture — Establish the daily data inputs that feed your forecast (deposits, outflows, committed spend).
- Phase 2: Map — Align your cash inflows to your outflow obligations and reinvestment windows on a daily and weekly timeline.
- Phase 3: Decide — Use the forecast to make inventory, ad spend, and supplier payment decisions with confidence.
- Phase 4: Recalibrate — Compare actuals to projections, identify variance patterns, and tighten the model over time.
These phases don’t happen in isolation. Capture feeds Map, Map enables Decide, Decide generates data for Recalibrate, and Recalibrate improves Capture. The system gets sharper with each cycle.
A rolling forecast transforms daily deposits into structured reinvestment decisions instead of reactive spending.
Step-by-Step: Building Your Daily Cash Flow Forecast
Step 1: Establish Your Daily Deposit Baseline
Objective: Know exactly what lands in your account each day, net of processing fees and chargebacks, so your forecast starts from reality rather than gross revenue figures.
Start by pulling 60 to 90 days of deposit history from your payment processor and bank account. You need the net deposit amount (after processing fees, chargebacks, and holds), not the gross sales figure your eCommerce platform reports. The difference between these two numbers is often 2.5% to 4%, which compounds into significant forecasting errors over time.
Build a simple daily log: date, gross sales, processing fees, chargebacks/holds, and net deposit. From this, calculate your average daily net deposit, your standard deviation (how much it fluctuates), and any day-of-week patterns. Most eCommerce businesses see higher deposits on Mondays (from weekend sales) and dips midweek.
Anti-patterns to avoid: Don’t use gross revenue as your baseline. Don’t assume every day will match the average. Don’t ignore chargeback patterns, as they create unpredictable deductions that can delay or reduce your available funds.
Success indicator: You can predict tomorrow’s net deposit within 10% to 15% accuracy based on today’s sales data and your historical fee/chargeback rate.
Step 2: Map Your Outflow Obligations on a Daily and Weekly Grid
Objective: Create a clear picture of when cash leaves your business so you can see your true available balance at any point in the week.
Daily deposits are only half the equation. You need an equally granular view of outflows. Categorize your outflows into three buckets:
- Fixed recurring: Rent, SaaS subscriptions, loan payments, payroll. These hit on predictable dates.
- Variable recurring: Ad spend, shipping costs, packaging supplies. These fluctuate with sales volume.
- Discretionary reinvestment: Inventory reorders, new product development, equipment. These are the decisions your forecast empowers.
Plot fixed and variable outflows on a weekly calendar. Overlay your expected daily deposits. This creates a daily “net cash position” view, showing you exactly which days you’ll have surplus cash and which days outflows will exceed inflows. Merchant Payments Coalition resources continue to highlight how payment timing inefficiencies and processing-related costs place ongoing pressure on merchant liquidity.
Anti-patterns to avoid: Don’t lump all outflows into monthly totals. A $12,000 monthly ad spend that bills daily ($400/day) looks very different in a daily forecast than one that bills weekly ($3,000 every Monday). Don’t forget about annual or quarterly payments that create spikes.
Success indicator: You can identify, at a glance, which days this week will have the most available cash for discretionary reinvestment.
Step 3: Identify Your Reinvestment Windows
Objective: Pinpoint the specific days and dollar amounts available for inventory reorders, ad scaling, or supplier payments so you can act on opportunities instead of reacting to them.
This is where daily deposits transform from a convenience into a competitive weapon. With your net cash position mapped daily, you can now identify “reinvestment windows”: the days when surplus cash exceeds your minimum operating buffer and can be deployed into growth.
Set a minimum cash buffer first. This is the amount you never touch, covering 5 to 10 days of fixed outflows. Everything above that buffer, on any given day, is available for reinvestment. For most established eCommerce businesses, the richest reinvestment windows appear on Mondays and Tuesdays (when weekend deposits land) and during promotional periods when daily revenue spikes.
Connect these windows to your supplier lead times. If your best-selling product has a 14-day reorder lead time, you need to place orders at least 14 days before you expect to need that inventory. Your forecast tells you whether you’ll have the cash to place that order on the optimal day, or whether you need to wait. This is the direct link between deposit timing and inventory positioning that most cash flow advice ignores entirely.
Anti-patterns to avoid: Don’t reinvest every dollar above your buffer. Leave room for variance. Don’t treat reinvestment windows as fixed; they shift with sales patterns, seasonality, and promotional calendars. Don’t ignore supplier payment terms. If a supplier offers a 2% discount for payment within 10 days, your forecast should flag whether you can capture that discount.
Success indicator: You have a forward-looking calendar showing available reinvestment dollars by day for the next 2 to 4 weeks.
Step 4: Build the Rolling 30-Day Forecast
Objective: Create a living document that projects your daily cash position 30 days forward, updating automatically as actuals replace projections.
Your rolling forecast is a spreadsheet or dashboard with one row per day and columns for: projected deposits, projected fixed outflows, projected variable outflows, planned reinvestment spend, projected ending balance, and actual ending balance (filled in as each day passes).
For projected deposits, use your baseline from Step 1, adjusted for known events (upcoming promotions, seasonal trends, marketing campaign launches). While for outflows, use your mapped obligations from Step 2. For reinvestment spend, use the windows identified in Step 3.
Federal Reserve payment system resources continue to emphasize the growing importance of real-time payment visibility, operational forecasting, and liquidity management across modern payment environments. If your eCommerce platform and payment processor both offer API access or reporting exports, connect them to your forecast to reduce manual data entry. Even a well-maintained spreadsheet works for businesses processing under $500K monthly, but automation pays for itself quickly above that threshold.
Processors like BAMS that offer next-day funding with a late cutoff time (9 PM EST) make this forecast more predictable because you know exactly when each day’s sales will settle, reducing the guesswork around deposit timing.
Anti-patterns to avoid: Don’t build the forecast and then ignore it for two weeks. Review it every morning for 5 minutes. Don’t project revenue growth without also projecting the corresponding increase in variable outflows (more sales means more shipping, more COGS, more ad spend).
Success indicator: Your projected ending balance matches your actual ending balance within 10% on at least 80% of days over a 30-day period.
Step 5: Stress-Test Against Peak Selling Scenarios
Objective: Ensure your forecast holds up during the periods that matter most, when revenue spikes, inventory moves fast, and reinvestment decisions carry the highest stakes.
Peak selling windows (holiday seasons, flash sales, product launches) are where daily deposit forecasting proves its value. Revenue can double or triple, but so can the pressure on your cash position. You’re reordering inventory faster, ad spend climbs, shipping costs spike, and refund/chargeback rates may increase.
Run three scenarios through your forecast for any upcoming peak period:
- Conservative: Revenue increases 30% above baseline, variable costs increase proportionally.
- Expected: Revenue increases 60% to 80%, with a slight lag in cost increases as you’ve pre-positioned inventory.
- Aggressive: Revenue doubles, requiring emergency reorders at premium shipping rates.
For each scenario, check whether your daily cash position stays above your minimum buffer. If the aggressive scenario shows you dipping below buffer on certain days, you have a decision to make now (while you have time) rather than during the peak itself. This might mean pre-ordering inventory, negotiating extended payment terms with suppliers, or securing a short-term credit line as a safety net.
Anti-patterns to avoid: Don’t only plan for the expected scenario. Don’t assume peak revenue will arrive evenly across days; it often concentrates on specific dates (Black Friday, Cyber Monday, the first day of a promotion). Don’t forget that refund rates typically increase 2 to 4 weeks after peak sales.
Success indicator: You have a documented plan for each scenario, including specific inventory orders, ad budget caps, and cash buffer adjustments.
Step 6: Recalibrate Weekly and Tighten the Model
Objective: Turn your forecast from a rough projection into a precision tool by systematically learning from the gap between what you predicted and what actually happened.
Every Friday (or whatever day closes your business week), compare your projected daily balances against actuals for the past 7 days. Calculate the variance for each day and look for patterns. Common patterns include:
- Consistently underestimating Monday deposits (weekend sales are stronger than projected)
- Consistently overestimating midweek deposits (organic traffic dips you haven’t accounted for)
- Variable outflows running 5% to 10% higher than projected (shipping cost creep, ad platform billing quirks)
Adjust your baseline assumptions based on these patterns. Over 4 to 6 weeks of weekly recalibration, your forecast accuracy should improve significantly. This is also the moment to review whether your reinvestment decisions from the prior week produced the expected returns. Did the inventory you reordered sell through? Did the ad spend increase produce proportional revenue?
This feedback loop is what transforms forecasting from a planning exercise into a decision-making system. Faster payment processing combined with automated insights helps businesses maximize liquidity, but only if you’re actively using the data to refine your approach. NACHA ACH Network resources continue to emphasize how settlement timing and payment processing workflows directly affect operational liquidity management.
Anti-patterns to avoid: Don’t skip recalibration because the week “felt normal.” Don’t adjust your model based on a single anomalous day; wait for patterns across 2 to 3 weeks before changing baseline assumptions. Don’t treat the forecast as a report to file. Treat it as a tool to use.
Success indicator: Your average daily variance decreases each month, and you can articulate why specific days deviated from projection.
Practical Examples: Daily Forecasting in Action
Scenario: Pre-Positioning Inventory Before a Flash Sale
An eCommerce brand selling fitness equipment plans a 48-hour flash sale. Their rolling forecast shows average daily net deposits of $8,200. During the sale, they project deposits of $18,000 to $22,000 per day. Their best-selling kettlebell has a 10-day supplier lead time.
Two weeks before the sale, the forecast shows $14,500 in available reinvestment cash above the minimum buffer. The operator places a $12,000 inventory order, leaving $2,500 as additional buffer. Because they receive next-day funding, the elevated deposits during the flash sale itself fund the increased shipping costs and ad spend in near real-time, preventing any cash crunch.
A competitor on a 3 to 5 day deposit cycle faces a different reality. Their flash sale revenue from Monday doesn’t arrive until Thursday or Friday. They either need to pre-fund all increased costs from existing reserves (reducing their buffer) or scale the promotion more conservatively. The daily-deposit operator can run a larger, more aggressive sale because their forecast confirms the cash will be there.
Scenario: Catching a Supplier Discount
A home goods eCommerce business receives a supplier offer: 3% discount on a $25,000 order if paid within 7 days instead of the standard 30. Their rolling forecast shows they’ll accumulate $27,800 in available reinvestment cash over the next 6 days from daily deposits. They accept the discount, saving $750, and their forecast confirms the buffer stays intact throughout.
Without a daily forecast, this decision would require gut instinct or a phone call to the accountant. With it, the operator can say yes in 10 minutes, confident in the numbers. Early payment incentives are a recognized cash acceleration tool, but you can only capture them if you know your cash position in real time.
Common Mistakes and Pitfalls
Treating daily deposits as daily budgets. Just because $8,000 landed today doesn’t mean $8,000 is available to spend. Your forecast accounts for upcoming fixed outflows; your bank balance doesn’t. Spending based on bank balance rather than forecasted available cash is the fastest path to a shortfall.
Ignoring the lag between revenue and refunds. Ecommerce refund windows typically run 14 to 30 days. A strong sales week today can produce a refund spike 3 weeks later. Your forecast should include a refund rate estimate (typically 5% to 15% depending on your category) applied with a time delay.
Over-optimizing for speed at the expense of accuracy. The goal isn’t to reinvest every dollar the moment it arrives. It’s to reinvest the right dollars at the right time. A forecast that’s 85% accurate and reviewed daily beats a perfect model that sits in a spreadsheet untouched.
Forgetting that processing fees are variable. Your effective processing rate changes with card mix (debit vs. credit vs. AMEX), transaction size, and chargeback volume. Build a fee variance of 0.3% to 0.5% into your deposit projections to avoid consistently overestimating net deposits.
What to Do Next
Start with Step 1. Pull 60 days of deposit history from your processor and bank, and calculate your average daily net deposit. This single number is the foundation everything else builds on, and it takes about 30 minutes.
From there, add your outflow map (Step 2) during the same week. Within 5 business days, you’ll have enough structure to identify your first reinvestment windows and make at least one inventory or ad spend decision with more confidence than you had before.
Don’t try to build the perfect forecast on day one. Build a functional one, use it for a week, recalibrate, and improve. The system gets better the more you use it. Revisit this guide as a reference when you hit a new scenario, whether that’s your first major peak season with daily deposits or a supplier negotiation where timing matters.
The operators who compound daily deposits into a structural advantage aren’t the ones with the fanciest tools. They’re the ones who built a simple forecast, reviewed it every morning, and let the data guide their reinvestment decisions.
Frequently Asked Questions
What is a cash flow acceleration strategy?
A cash flow acceleration strategy is any approach that shortens the time between earning revenue and having usable cash in your account. For eCommerce businesses, the most direct lever is deposit timing: switching from a 3 to 5 day settlement cycle to next-day or same-day funding. Other strategies include automating invoicing to reduce payment delays, negotiating better supplier terms, and offering early payment incentives to customers. The goal is to accelerate cash inflows so you can reinvest faster and reduce reliance on credit.
How does daily funding change the way I should forecast cash flow?
Daily funding shifts your forecast from a weekly or monthly projection to a daily one. Instead of estimating when large batch deposits will arrive, you’re tracking a steady stream of smaller, more predictable deposits. This means your forecast needs to be more granular (daily rows, not weekly summaries) but also becomes more accurate because each day’s projection covers a shorter, more predictable window. The key change is that your forecast becomes a daily decision tool, not a monthly planning document.
Why is optimizing merchant services important for cash flow?
Your merchant services provider controls two variables that directly affect your cash position: processing fees (which reduce your net deposit) and settlement speed (which determines when you can use your revenue). Even a 0.5% reduction in effective processing fees on $500,000 in monthly sales returns $2,500 per month. And moving from 3-day to next-day settlement gives you access to that revenue 48 hours sooner, which compounds into meaningful reinvestment capacity over a full year.
How can I improve cash flow forecasting with real-time data?
Connect your eCommerce platform’s sales data to your forecast (via API, export, or manual daily entry) so you can see today’s sales and estimate tomorrow’s deposit before it arrives. Layer in your payment processor’s settlement reports for net deposit amounts. The combination of real-time sales data and historical deposit patterns gives you a 24-hour forward view that’s accurate enough to make same-day reinvestment decisions. Automating this connection reduces manual effort and improves consistency.
What size cash buffer should I maintain with daily deposits?
A practical starting point is 5 to 10 days of fixed operating expenses. If your fixed daily outflows (rent, payroll, subscriptions, minimum ad spend) total $3,000 per day, your buffer should be $15,000 to $30,000. The exact number depends on your revenue volatility, refund rate, and risk tolerance. Businesses with higher seasonal swings or higher refund rates should lean toward the upper end. Review and adjust your buffer quarterly as your cost structure evolves.
Can daily deposits help me negotiate better supplier terms?
Yes. When you can demonstrate (and act on) consistent, predictable cash availability, you’re in a stronger position to capture early payment discounts, negotiate volume pricing, or secure priority fulfillment during high-demand periods. Suppliers value reliable, fast-paying customers. Your daily forecast gives you the confidence to commit to faster payment terms because you can verify, in advance, that the cash will be available on the required date.
Sources
- Federal Reserve Small Business Survey Report
- Modern Treasury Payment Operations Resources
- NACHA ACH Network Resources

