Cash Flow Acceleration Strategies for Ecommerce
How to turn next-day deposits into faster restocking cycles that outpace your competitors
Learn how to restructure your cash flow forecast around daily funding and map deposit timing directly to inventory reinvestment. This guide builds a rolling forecast model that converts deposit speed into restocking agility.
TL;DR
- Daily deposits require daily forecasting — A monthly forecast can’t capture the variability and opportunity that next-day funding creates. Build a rolling 14-day forecast updated every morning.
- Map your actual daily inflow pattern — Don’t divide monthly revenue by 30. Pull 60-90 days of data and learn your daily floor, ceiling, and day-of-week trends to forecast accurately.
- Align outflows to follow your highest-revenue days — Schedule supplier payments, ad spend, and discretionary costs on days after your strongest sales days so cash is always available when it’s needed.
- Set reinvestment triggers, not fixed schedules — Define a cash surplus threshold that signals when to restock or scale spend. This converts deposit speed into purchasing agility and faster inventory turnover.
- Maintain a non-negotiable cash floor — Keep 5-7 days of operating expenses as a buffer. Daily deposits feel abundant, but consecutive slow days or chargeback holds can drain your position quickly.
Guide Orientation: What This Covers and Who It’s For
This guide teaches eCommerce managers how to forecast cash flow when deposits hit your account daily (or next-day) instead of on a traditional 3-to-5-day cycle. If you manage an established online business with 10 to 50 employees, and you’re exploring cash flow acceleration strategies to turn faster deposits into a genuine competitive edge, this is built for you.
By the end, you’ll understand how to restructure your cash flow forecast around daily funding, map deposit timing directly to inventory reinvestment cycles, and build a rolling forecast model that converts deposit speed into restocking agility. This guide does not cover general bookkeeping, invoicing best practices for B2B receivables, or how to choose an accounting platform.
What it does cover: the operational mechanics of forecasting when money arrives every day, and the specific decisions that let you reinvest faster than competitors still waiting on weekly batches.
Why Cash Flow Acceleration Strategies Matter More Than Ever for eCommerce
Ecommerce operators face a structural timing problem. Customers pay instantly at checkout, but the money doesn’t land in your bank account for days. That gap creates a phantom liquidity shortage: your revenue exists, but you can’t use it. Meanwhile, suppliers expect payment, ad platforms debit daily, and popular SKUs go out of stock.
The consequences are not theoretical. Federal Reserve Small Business Survey data continues to show that firms facing cash flow challenges frequently delay investments, inventory purchases, and operational spending because funds are unavailable at the moment decisions need to happen. For eCommerce, delayed inventory often compounds into lost rankings, weaker ad efficiency, and reduced customer trust.
The shift toward daily or next-day funding from payment processors changes this equation fundamentally. But faster deposits only become an advantage if your forecasting adapts to match. Most eCommerce teams still forecast on weekly or monthly cycles, which means the cash arrives daily but decisions are still made on old timelines. Closing that gap is where the real competitive leverage lives.
59% of firms with cash flow challenges report delaying investments or purchases as a result. If your competitors are stuck in that cycle while you’re restocking the same day revenue clears, you’re operating on a fundamentally different clock.
Core Concepts: The Language of Daily Cash Flow Forecasting
Funding Cycle vs. Revenue Cycle
Your revenue cycle is when customers pay. Your funding cycle is when that money becomes usable in your bank account. In traditional merchant processing, the funding cycle lags the revenue cycle by 2 to 5 business days. With next-day funding, that gap shrinks to roughly 24 hours. Every forecasting decision depends on understanding which cycle you’re actually tracking.
Rolling Forecast vs. Static Forecast
A static forecast projects cash flow for a fixed period (a month, a quarter) and stays unchanged until the next planning cycle. A rolling forecast updates continuously, adding new actual data as it arrives and extending the projection window forward. Daily deposits demand a rolling approach because your cash position changes meaningfully every 24 hours.
Reinvestment Velocity
This is the speed at which revenue converts into new inventory or growth spending. It’s the metric this entire guide orbits. Reinvestment velocity is not just about having cash. It’s about having cash at the moment a purchasing decision needs to happen. A business with $50,000 in monthly revenue and next-day funding can reinvest that revenue 20+ times per month. The same business on a weekly payout cycle gets roughly 4 reinvestment windows.
Common Misconception: Faster Deposits = Better Cash Flow
Not automatically. Faster deposits improve liquidity (cash available right now), but cash flow is the net movement of money in and out over time. If your outflows are poorly timed or your forecast doesn’t account for daily variability, next-day funding can actually create a false sense of security. The advantage only materializes when you forecast and act on the new rhythm.
The Framework: Daily Deposit Forecasting in Four Phases

The businesses moving fastest are not just getting deposits sooner. They are operating from a daily cash command system.
Forecasting cash flow on a daily deposit cycle follows a four-phase loop. Each phase feeds the next, and the system gets more accurate with each rotation.
- Phase 1: Map Your Daily Inflow Pattern — Establish what your revenue actually looks like day by day, not averaged across a month.
- Phase 2: Align Outflows to Deposit Timing — Restructure when you pay suppliers, platforms, and vendors to match when cash actually arrives.
- Phase 3: Build a Rolling 14-Day Forecast — Create a short-horizon, continuously updated projection that reflects daily cash positions.
- Phase 4: Convert Surplus Days into Reinvestment Triggers — Identify the specific days when your cash position supports restocking or growth spending, and act on them systematically.
These phases are cyclical. As your business grows or seasonality shifts, you return to Phase 1 with better data and tighter execution. The goal is not a perfect prediction. It’s a decision system that tells you when to buy, when to hold, and when to accelerate.
Step-by-Step: Forecasting Cash Flow on a Daily Deposit Cycle
Step 1: Map Your Daily Inflow Pattern
Objective: Understand the actual shape of your daily revenue, not just the monthly total.
Pull 60 to 90 days of transaction data from your payment processor and break it down by day of the week. Most eCommerce businesses show clear patterns: higher volume on certain weekdays, dips on others, and spikes around promotions or paydays. You need to see these patterns at the daily level because that’s now how your cash arrives.
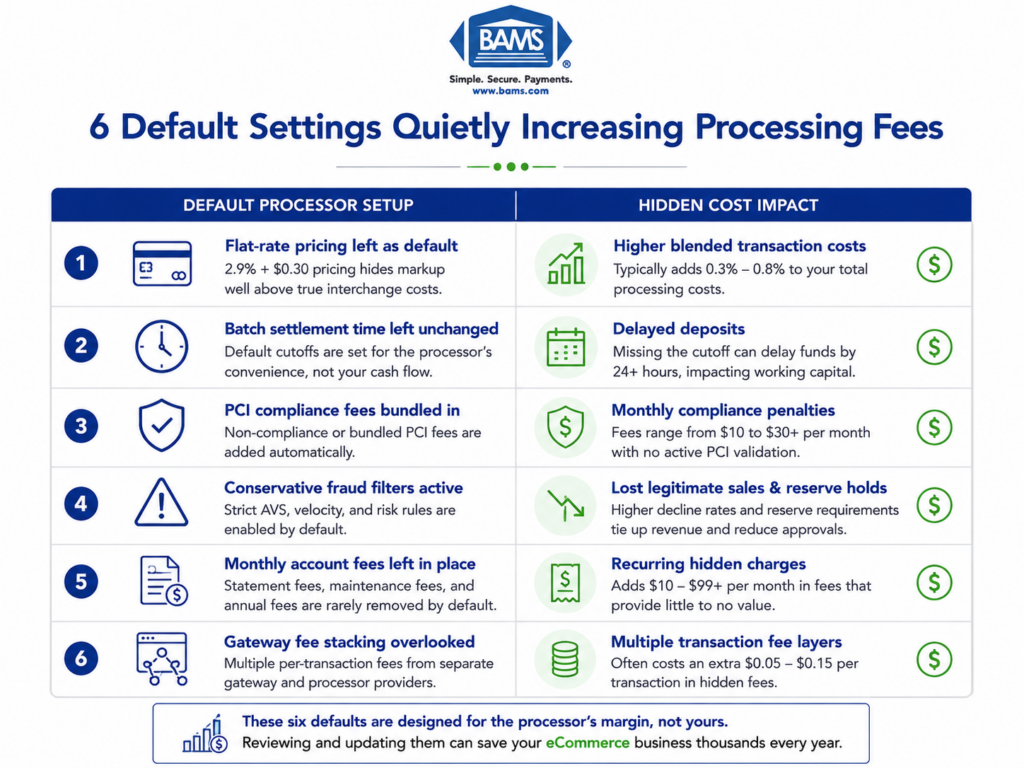
Create a simple spreadsheet (or use your accounting platform’s reporting) that shows gross daily sales, processing fees deducted, and net deposit amount. The net deposit is your real inflow number. Gross revenue is misleading when processing fees, holds, and batch timing reduce what actually hits your account.
Calculate your daily average, but more importantly, calculate your daily floor (the lowest typical day) and daily ceiling (the highest non-promotional day). These three numbers form your inflow range for forecasting.
Anti-patterns: Don’t average your monthly revenue and divide by 30. This hides the variability that makes daily forecasting valuable. Don’t ignore weekends and holidays when deposits may not process, even if orders are placed.
Success indicators: You can state your typical Tuesday net deposit versus your typical Saturday net deposit with confidence. You know which days consistently fall below your daily operating cost threshold.
Step 2: Align Outflows to Deposit Timing
Objective: Restructure payment schedules so outflows follow inflows rather than preceding them.
List every recurring outflow: supplier payments, ad platform charges, SaaS subscriptions, payroll, shipping costs, and platform fees. For each, note the current payment date and whether it’s flexible. Many eCommerce operators pay suppliers on fixed terms (Net 15, Net 30) but let ad platforms and subscriptions debit whenever they default to.
With daily deposits, you can strategically schedule flexible outflows on days that follow your highest-revenue days. If Wednesday and Thursday are your strongest sales days, schedule supplier payments for Friday. If Monday is your weakest day, avoid scheduling discretionary spending there.
Research on seasonal small businesses confirms this approach: structuring billing to receive cash before major outflows is one of the most effective cash flow management techniques available. The same logic applies to eCommerce on a daily scale.
Anti-patterns: Don’t assume all outflows are fixed. Many suppliers will adjust payment dates if asked, especially for reliable accounts. Don’t ignore the timing of ad platform debits, which can create unexpected daily cash drains.
Success indicators: You have a calendar view showing daily expected inflows and outflows. No single day shows outflows exceeding inflows by more than your cash buffer can absorb.
Step 3: Build a Rolling 14-Day Forecast
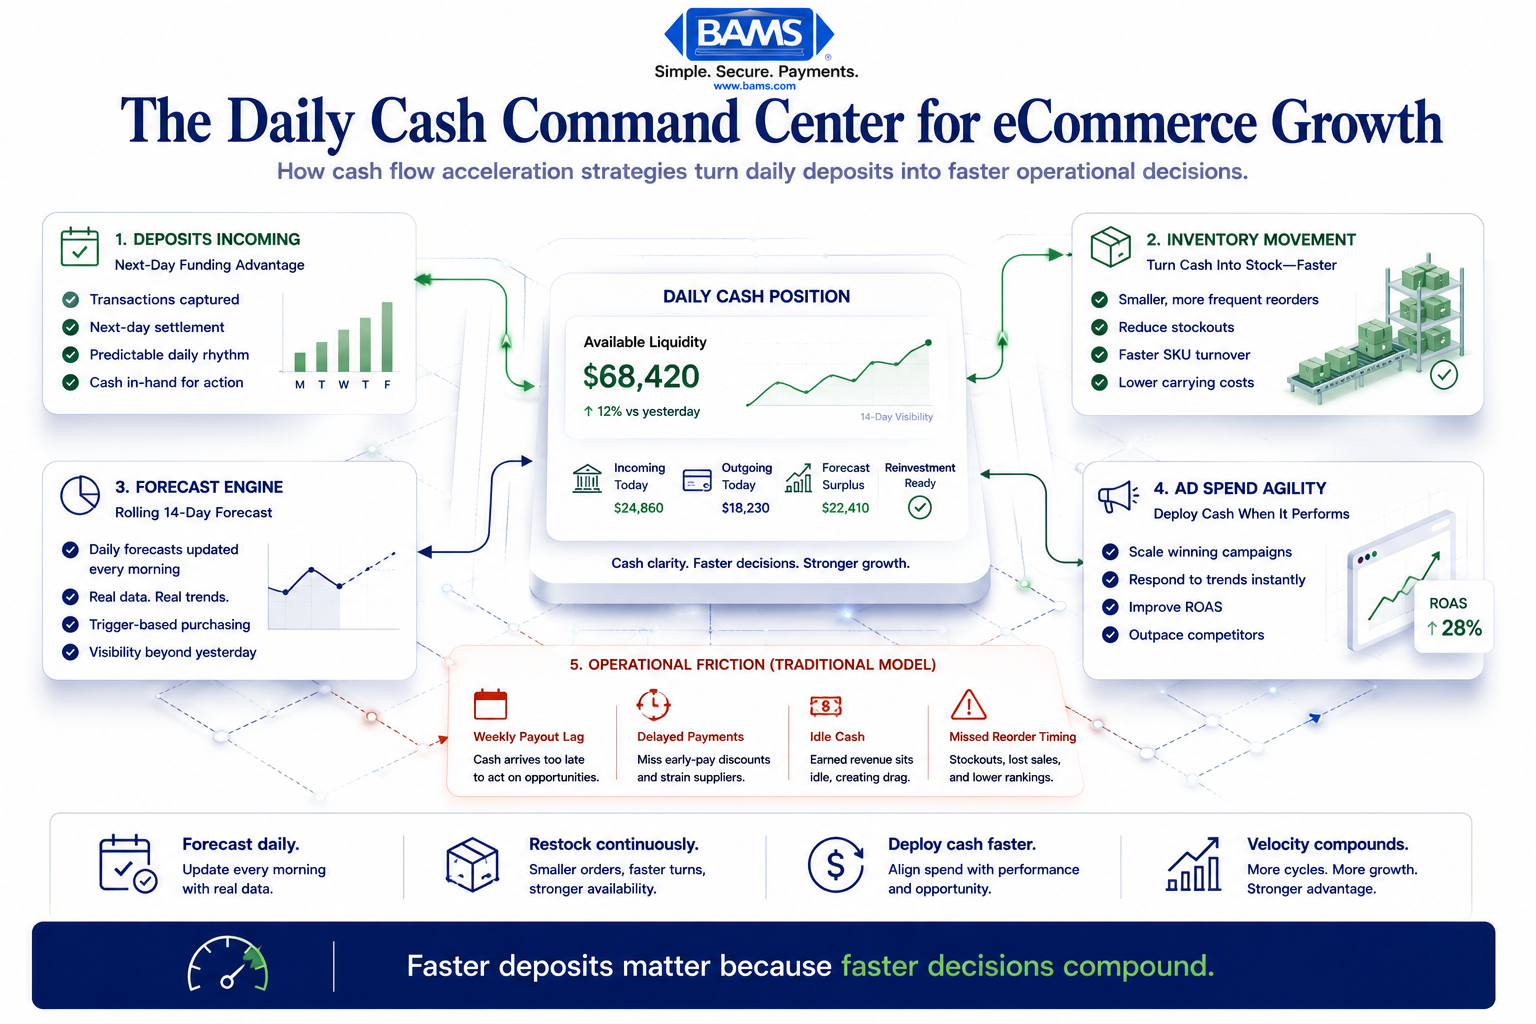
A rolling 14-day forecast transforms deposit timing into a daily operational decision system.
Objective: Maintain a continuously updated, short-horizon cash flow projection that reflects your actual daily position.
A 14-day rolling forecast is the operational sweet spot for eCommerce businesses on daily funding. It’s long enough to see upcoming cash crunches or surpluses, and short enough to stay accurate. Modern Treasury payment operations resources continue to emphasize how real-time visibility into inflows, settlement timing, and reconciliation workflows improves operational forecasting accuracy.
Structure your forecast with these columns for each day: opening cash balance, expected deposits (using your daily pattern from Step 1), confirmed outflows, discretionary outflows, and closing cash balance. Each morning, replace yesterday’s forecast with the actual numbers and extend the window one day forward.
The critical discipline here is updating daily. Around 52% of finance leaders still rely on spreadsheets for cash flow forecasting, and while spreadsheets work fine for this model, they only work if someone opens them every day. Assign ownership. Make the daily update a 10-minute morning task, not a monthly project.
Anti-patterns: Don’t build a 90-day forecast and check it monthly. The precision degrades rapidly past two weeks for daily-funded businesses. Don’t treat the forecast as a report to review. Treat it as a decision tool to act on.
Success indicators: Your forecast’s predicted closing balance matches your actual closing balance within 10% on most days. You can identify cash surplus days at least 5 days in advance.
Step 4: Set Reinvestment Triggers Based on Cash Position
Objective: Define specific cash thresholds that automatically signal when to restock, scale ad spend, or hold.
This is where daily deposits become an operational weapon. Instead of restocking on a fixed schedule (“we order inventory every two weeks”), you restock when your rolling cash position hits a predefined surplus threshold. This means you buy when you can afford to, which, with daily deposits, happens far more frequently than with weekly or biweekly funding.
Define three thresholds in your forecast: a floor (minimum cash balance you never go below, typically 5 to 7 days of operating expenses), a reinvestment trigger (the balance above which surplus cash should be deployed), and a scale trigger (the balance that signals you can increase ad spend or place larger supplier orders for volume discounts).
When your closing balance on any given day exceeds the reinvestment trigger, that’s your signal to place a restocking order or increase spend. This approach turns cash flow forecasting from a passive reporting exercise into an active purchasing system. Improving inventory turnover is consistently listed as a top cash flow improvement priority, and trigger-based restocking directly accelerates turnover.
Anti-patterns: Don’t set your floor too low. Unexpected chargebacks, refund spikes, or supplier price increases can drain your buffer overnight. Don’t treat the reinvestment trigger as optional guidance. If you don’t act on surplus days, the cash sits idle and the speed advantage disappears.
Success indicators: You restock more frequently in smaller batches. Your average days-of-inventory decreases without increasing stockout frequency. Your cash utilization rate (percentage of available cash actively deployed) increases.
Step 5: Stress-Test for Variability and Seasonality
Objective: Ensure your forecast holds up under realistic worst-case and best-case scenarios.
Daily deposits introduce daily variability. A single slow sales day doesn’t matter much, but three consecutive slow days can push you below your floor if outflows are poorly timed. Build two scenario layers into your 14-day forecast: a “soft week” scenario (using your daily floor numbers from Step 1 for 5 consecutive days) and a “surge” scenario (using your daily ceiling numbers for 5 consecutive days).
Run both scenarios every week. The soft week tells you whether your cash buffer is adequate. The surge scenario tells you whether you have the supplier relationships and logistics capacity to actually deploy surplus cash quickly. Many eCommerce businesses discover that their bottleneck isn’t cash at all. It’s the inability to place and receive inventory orders fast enough to match their funding speed.
For seasonal businesses, overlay your historical seasonal curve onto the 14-day forecast. If you know November revenue runs 3x your baseline, your reinvestment triggers should adjust upward to match. If January drops 40%, your floor should increase to provide a larger buffer.
Anti-patterns: Don’t assume tomorrow will look like today. Merchant Payments Coalition resources continue to highlight how rising operational costs and payment-related expenses create additional cash flow pressure for merchants operating with thin margins.
Success indicators: Your soft-week scenario never drops below your floor for more than one day. Your surge scenario has a clear action plan (pre-negotiated supplier terms, pre-approved ad budgets) ready to execute.
Step 6: Accelerate the Inflow Side of the Equation
Objective: Reduce every remaining friction point between a customer’s payment and your usable cash.
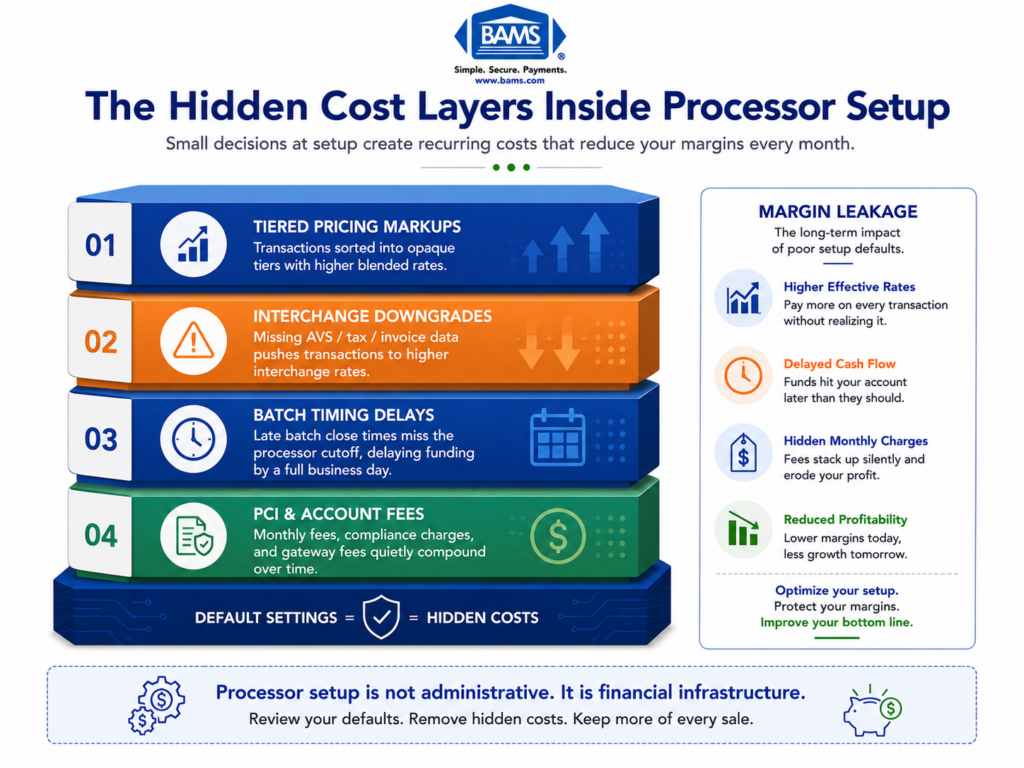
Even with next-day funding, gaps exist. Batch cutoff times determine whether today’s sales fund tomorrow or the day after. Chargeback holds can freeze portions of your deposits. Refund timing creates outflows that don’t align with your forecast.
Start by confirming your processor’s batch cutoff time. A processor with a 5 PM cutoff means sales after 5 PM don’t fund until two days later. BAMS offers a 9 PM EST cutoff for next-day funding, which captures a significantly larger share of daily transactions in the same-day batch, especially for eCommerce businesses whose peak hours often extend into the evening.
Next, address chargebacks proactively. Every chargeback hold reduces your usable deposit and creates forecasting noise. Understanding why funding can take longer than expected helps you identify which holds are preventable and which require process changes on your end.
Finally, if you sell through invoiced channels alongside your eCommerce storefront, consider email invoicing tools that automate follow-up and reduce days sales outstanding on those receivables.
Anti-patterns: Don’t assume all next-day funding programs are equal. Cutoff times, eligible transaction types, and hold policies vary significantly between processors. Don’t ignore chargebacks as a forecasting variable. Even a 1-2% chargeback rate creates meaningful daily cash variance.
Success indicators: Your batch capture rate (percentage of daily sales included in the same-day batch) exceeds 90%. Your chargeback-related holds decrease quarter over quarter. Your forecast accuracy on the inflow side improves to within 5% daily.
Practical Example: How Daily Forecasting Changes a Restocking Decision
Scenario: A Mid-Size eCommerce Brand Selling Consumer Goods
Consider an online retailer doing $600,000 in monthly revenue, with an average daily net deposit of roughly $20,000. On a traditional 3-day funding cycle, this business receives approximately $60,000 every three days. Their restocking cycle matches: they review inventory twice a week and place orders on Tuesdays and Fridays.
After switching to next-day funding, the same $20,000 arrives every morning. But initially, nothing changes operationally because their forecast and purchasing cadence are still built for biweekly review.
The Shift
The operations manager implements the framework above. She maps daily inflows (Mondays average $15,000, Wednesdays average $24,000) and aligns supplier payments to follow peak days. She builds a 14-day rolling forecast and sets a reinvestment trigger at $35,000 (roughly 1.75 days of operating expenses above the floor).
Within the first month, she places 11 restocking orders instead of the usual 8. Each order is smaller, reducing the risk of overstocking slow-moving SKUs. Her bestselling items stay in stock 96% of the time, up from 88%. Her inventory carrying cost drops because she’s holding less safety stock.
The Competitive Gap
Her main competitor, operating on a weekly funding cycle, can only restock 4 times per month. When a product trends on social media and demand spikes, the competitor stocks out for 3 days while waiting for funds to clear. Our operator restocks the next morning. She captures the surge. The competitor loses the ranking.
This is what reinvestment velocity looks like in practice. The advantage isn’t the deposit speed itself. It’s the forecasting system that converts deposit speed into purchasing decisions.
Common Mistakes and Pitfalls
Treating daily deposits as daily profit. Revenue is not profit. Every deposit includes money owed to suppliers, ad platforms, taxes, and overhead. Forecasting on gross deposits without netting out committed costs leads to overspending.
Abandoning the buffer. Daily cash feels abundant, which tempts operators to deploy everything. Maintain your floor religiously. 82% of small businesses experience cash flow problems, and most of them thought they had enough until they didn’t.
Forecasting monthly on a daily system. If your deposits arrive daily but your forecast updates monthly, you’re driving with a rearview mirror. The 14-day rolling forecast only works if it actually rolls.
Ignoring processing fee variability. Different card types carry different interchange rates. A day heavy on corporate credit cards will net less than a day heavy on debit cards. Build fee variability into your inflow estimates.
Optimizing inflows without fixing outflows. Faster deposits don’t help if your outflow timing is chaotic. The alignment step (Step 2) is where most of the practical value lives.
What to Do Next
Start with Step 1. Pull 60 days of transaction data and map your daily inflow pattern. This single exercise will reveal more about your cash flow dynamics than any monthly P&L review. It takes about an hour, and the pattern it reveals will inform every decision that follows.
If you’re currently on a multi-day funding cycle, investigate what next-day funding would look like with your processor. Compare batch cutoff times, hold policies, and eligibility requirements. The operational value of daily forecasting depends entirely on whether your deposits actually arrive daily.
Then build your first 14-day rolling forecast. It doesn’t need to be perfect. It needs to exist, and it needs to update every morning. Treat it as a living document, not a finished report. As 91% of CFOs agree, better cash forecasting directly improves decision-making. Start small, improve iteratively, and let the data guide your reinvestment rhythm.
Revisit this guide as your business scales or seasonality shifts. The framework stays the same. The numbers inside it will evolve.
Frequently Asked Questions
What is a cash flow acceleration strategy?
A cash flow acceleration strategy is any deliberate action that shortens the time between earning revenue and having usable cash in your account. For eCommerce businesses, the most impactful strategy is reducing the funding cycle from your payment processor (moving from 3-5 day deposits to next-day deposits) and then restructuring your purchasing and forecasting cadence to match. It’s not just about speed. It’s about converting that speed into operational decisions like faster restocking and better-timed supplier payments.
How does next-day funding actually improve liquidity for eCommerce businesses?
Next-day funding means the revenue from today’s sales hits your bank account tomorrow morning instead of 3 to 5 business days later. For a business doing $20,000 per day in sales, that’s the difference between having $20,000 available tomorrow and having $0 available for three days. This directly increases your working capital at any given moment, letting you pay suppliers sooner, avoid credit line usage, and restock without waiting. The liquidity improvement is proportional to your daily sales volume.
Why should I forecast on a 14-day rolling basis instead of monthly?
Monthly forecasts average out the daily variability that daily deposits expose. If your cash arrives every day, your purchasing opportunities also arise every day. A 14-day rolling forecast gives you enough forward visibility to spot upcoming cash crunches or surpluses while staying accurate enough to act on. Beyond 14 days, eCommerce revenue predictions lose reliability due to promotional cycles, ad performance shifts, and demand fluctuations.
How can I improve cash flow forecasting with real-time data?
Start by connecting your payment processor’s reporting to your forecast model so deposit amounts update automatically. Layer in your ad platform spend data and supplier payment schedules. The goal is to see your projected cash position for the next 14 days, updated each morning with yesterday’s actuals. Even a well-maintained spreadsheet works if it’s updated daily. The key is consistency of input, not sophistication of the tool.
What’s the right cash buffer to maintain with daily deposits?
A common starting point is 5 to 7 days of operating expenses as your floor, meaning the minimum balance you never dip below. This accounts for unexpected slow days, chargeback holds, refund spikes, or supplier price increases. Your specific floor depends on your cost structure and revenue variability. Businesses with higher daily variability need a larger buffer. Review and adjust your floor quarterly as your revenue patterns evolve.
Which payment solutions can help reduce processing fees while improving deposit speed?
Look for processors that offer next-day funding with late batch cutoff times, transparent interchange-plus pricing (so you can see exactly what each transaction costs), and proactive chargeback defense to reduce holds on your deposits. Avoid processors that bundle fees in ways that obscure your true per-transaction cost, as this makes daily net deposit forecasting inaccurate. The combination of faster funding and lower, more predictable fees directly improves both your liquidity and your forecast accuracy.