13-Week Cash Flow Forecasting for eCommerce: A Daily Deposit Framework
Last Updated on July 24, 2026 by Dimitri Akhrin
How to rebuild your forecasting model when deposit timing shifts from weekly batches to same-day funding
Learn how to build a 13-week cash flow forecasting model calibrated for same-day or next-day deposit cycles. This step-by-step tutorial covers daily time buckets, reconciled balances, and a refresh cadence that keeps forecast variance under 10%.
TL;DR
- Your old forecast breaks when deposit timing changes – A model built for 3-5 day settlement underestimates early-week cash and overestimates late-week cash once you switch to next-day funding.
- Rebuild around daily time buckets – Use a 13-week spreadsheet with one row per calendar day, reconciled opening balances, and net deposit amounts (not gross revenue) from your processor.
- Calculate your actual settlement lag – Export 90 days of deposit history, measure the gap between transaction date and bank posting date, and use that number (not your processor’s marketing claim) in your model.
- Reconcile every morning – Overwrite your opening balance with the actual bank balance daily. This 15-minute habit prevents small errors from compounding into large forecast misses.
- Use the forecast to accelerate restocking – With next-day deposits, you can place supplier orders 2-3 days earlier, capture early payment discounts, and reduce the cash buffer you need to hold idle.
What You’ll Achieve: A Forecasting Model Built for Daily Deposits
By the end of this tutorial, you will have a working cash flow forecasting model calibrated specifically for same-day or next-day deposit cycles. Your forecast will use daily time buckets, reconciled opening balances, and a structured refresh cadence so restocking decisions, ad spend, and supplier payments run on accurate numbers.
Your success criteria are simple: you can predict your available cash for any given day within the next 13 weeks, and your forecast variance stays under 10% week over week. If you currently guess when funds will land or pad timelines “just in case,” this tutorial replaces that uncertainty with a repeatable system.
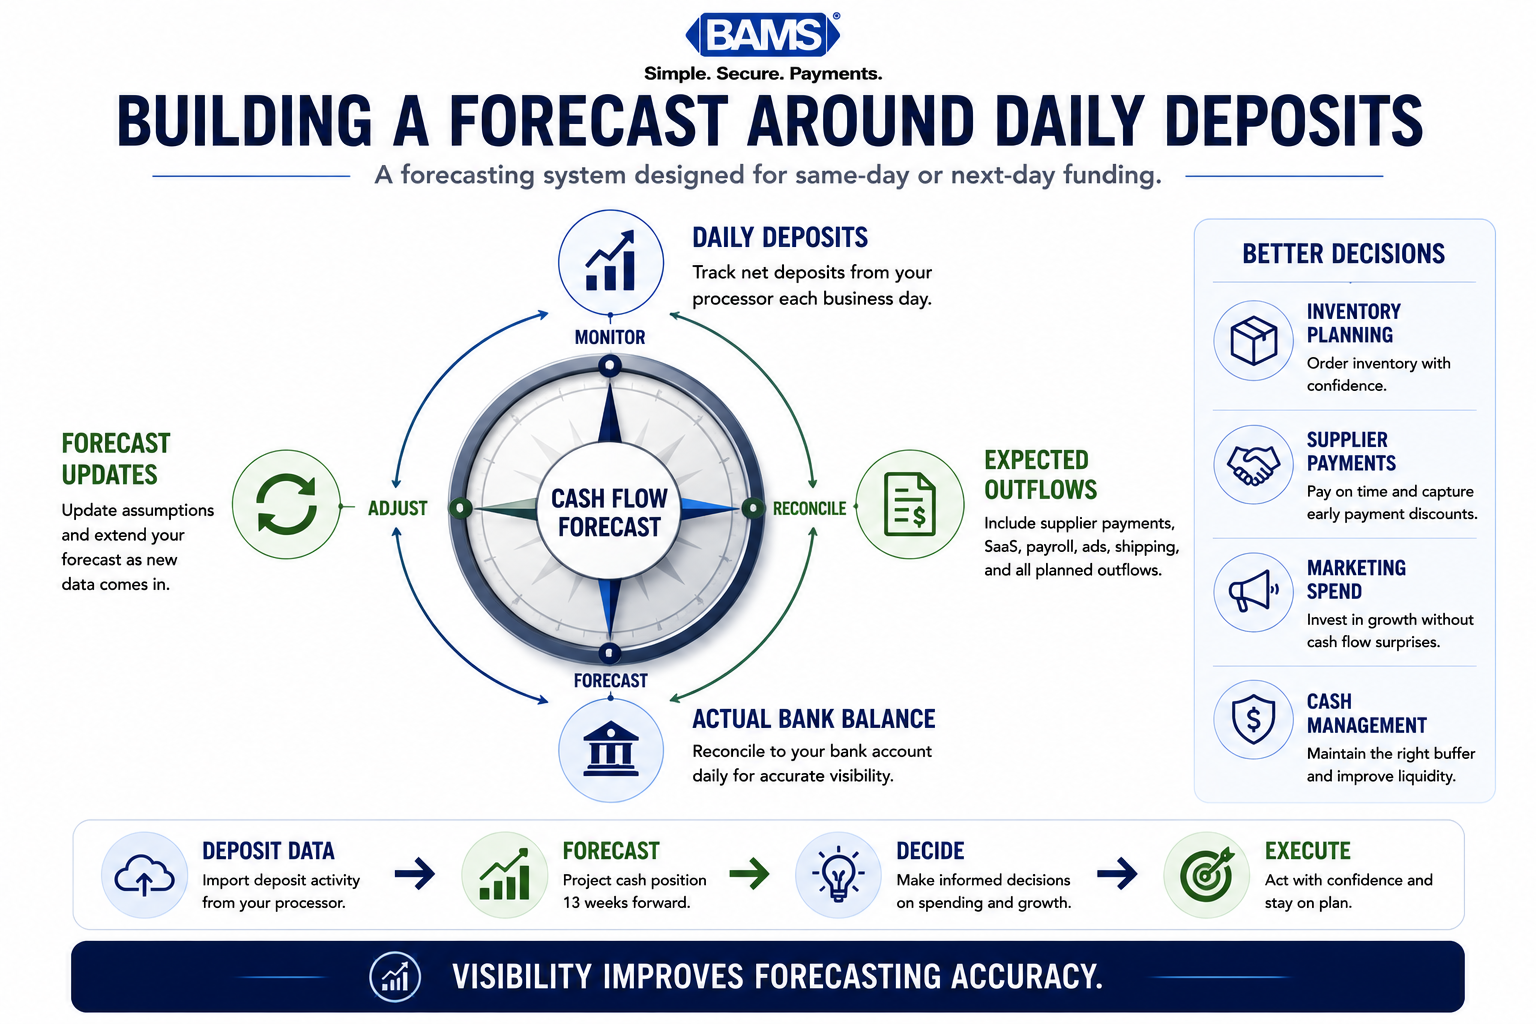
Faster funding requires a forecasting model built around daily visibility.
Prerequisites and Setup Checklist
Before you start, confirm you have the following in place. Missing any one of these will slow you down or introduce errors early.
- Spreadsheet or planning tool (Google Sheets, Excel, or a dedicated treasury tool). A spreadsheet template is enough to start.
- Access to your payment processor dashboard with deposit history for the last 90 days minimum.
- Bank account transaction export (CSV or OFX) covering the same 90-day window.
- A list of recurring outflows: supplier payments, SaaS subscriptions, payroll dates, ad platform billing cycles, shipping costs.
- Your current deposit schedule: know whether you receive funds same-day, next-day, or on a 2-3 day hold.
- Approximately 3-4 hours for the initial build, then 15-20 minutes per day for ongoing refreshes.
Potential blocker: If your ERP or accounting software posts bank transactions with a delay, you’ll need to reconcile manually until that lag is resolved. Flag this now so it doesn’t surprise you at Step 4.
Why Your Old Model Breaks When Deposit Timing Changes
Most eCommerce cash flow forecasts assume a 3-5 day settlement window. Revenue recognized on Monday lands in your bank account Thursday or Friday. Your model accounts for that gap, and your purchasing decisions factor it in.
When you switch to same-day or next-day funding, that gap collapses. The ACH Network and expanded Same-Day ACH capabilities have helped reduce settlement delays for many payment types, making deposit timing more predictable. Suddenly, Monday’s sales hit your account by Tuesday morning. Your old model still expects Thursday, so it underestimates available cash early in the week and overestimates it later. The result: you either sit on money you could reinvest or, worse, make spending decisions based on phantom balances.
According to the Federal Reserve’s 2025 Small Business Credit Survey, managing cash flow and operating expenses remains a significant challenge for many businesses. Forecasting accuracy becomes increasingly important as funding cycles accelerate and cash becomes available sooner. This isn’t just a planning inconvenience. It’s a balance-sheet risk. The fix is a recalibration, not a complete rebuild.
Step 1: Export and Map Your Actual Deposit History
Action: Log into your payment processor dashboard and export your deposit history for the last 90 days. Export as CSV. Then do the same from your bank account.
Align the two exports side by side in your spreadsheet. For each deposit, record three dates: the transaction date (when the customer paid), the settlement date (when the processor released funds), and the bank posting date (when cash appeared in your account).
Expected result: You should see a clear pattern. If you recently switched to faster funding, you’ll notice the gap between transaction date and bank posting date shrink from 3-5 days to 0-1 days. Mark the exact date the switch happened.
Common failure: Deposits don’t match between processor and bank exports. This usually means your processor batches multiple transactions into a single deposit. Group transactions by deposit ID or settlement batch number to reconcile.
Step 2: Calculate Your New Average Settlement Lag
Action: Using only the post-switch data (after your funding speed changed), calculate the average number of calendar days between transaction date and bank posting date.
In your spreadsheet, create a column with the formula:
=Bank_Posting_Date – Transaction_Date
Then average that column across all post-switch deposits. Also calculate the median and the 95th percentile lag. The median tells you the typical experience; the 95th percentile tells you the worst-case scenario you should plan around.
Expected result: With next-day funding, your average should be approximately 1 calendar day, with the 95th percentile at 1-2 days (weekends and holidays may push some deposits). If you see outliers at 3+ days, investigate those specific transactions for holds or flags.
Checkpoint: If your average settlement lag is 1.0 days or less, your processor is delivering as expected. If it’s consistently higher, check whether your batch cutoff time is causing transactions to roll into the next cycle.
Step 3: Build Your Daily Cash Flow Forecasting Template
Action: Create a spreadsheet with one row per calendar day, spanning 13 weeks (91 days). This is the standard short-term liquidity structure used by treasury teams, and daily buckets are essential when your deposit cycle is measured in hours rather than days.
Your columns should be:
- Date
- Opening Cash Balance (previous day’s closing balance)
- Estimated Inflows (deposits expected to land that day)
- Estimated Outflows (all payments leaving your account that day)
- Net Cash Flow (Inflows minus Outflows)
- Closing Cash Balance (Opening + Net Cash Flow)
- Actual Cash Balance (filled in daily during reconciliation)
- Variance (Actual minus Forecast)
Key detail: Your opening cash balance on Day 1 must come from a reconciled bank balance, not your accounting software’s estimate. Forecasting errors are frequently driven by unreconciled cash accounts and delayed ERP posting. Start with the number your bank confirms.
Step 4: Populate Inflows Using Your Daily Sales Rhythm
Action: Pull your daily gross sales data for the past 90 days from your eCommerce platform (Shopify, WooCommerce, BigCommerce, etc.). Calculate the average daily sales for each day of the week separately. Monday’s average will differ from Saturday’s.
For each future day in your 13-week forecast, enter the corresponding day-of-week average as your baseline inflow estimate. Then apply your settlement lag from Step 2. If your average lag is 1 day, Monday’s sales become Tuesday’s deposit.
Adjustments to layer in:
- Promotional periods: If you have a sale planned, increase that day’s estimate by your historical lift percentage.
- Seasonality: Compare the same period from last year. If December typically runs 2x your baseline, scale accordingly.
- Refunds and chargebacks: Deduct your average daily refund rate from gross inflows. This is cash leaving, not arriving.
Common failure: Forecasting gross sales instead of net deposits. Your processor deducts fees before depositing. Use net deposit amounts from your processor export, not top-line revenue from your eCommerce dashboard.
Step 5: Map All Outflows to Exact Calendar Dates
Action: List every recurring and planned outflow, then assign each to its exact calendar date in your 13-week forecast. Be specific. “Rent” isn’t useful. “Rent, $4,200, 1st of each month” is.
Common eCommerce outflows to capture:
- Inventory/restocking orders (supplier payment terms: net 15, net 30, or prepay)
- Shipping and fulfillment costs (daily or weekly billing)
- Ad spend (Google and Meta typically charge daily or at threshold)
- SaaS subscriptions (monthly, annual renewal dates)
- Payroll and contractor payments (biweekly or monthly)
- Loan repayments
- Tax remittances (quarterly estimated payments)
Checkpoint: After populating outflows, scan for “cash crunches” where your closing balance dips below your minimum comfortable threshold. With daily deposits, these crunches may be smaller and shorter than before, but they still happen, especially around payroll or large inventory orders.
Step 6: Set Your Daily Reconciliation Routine
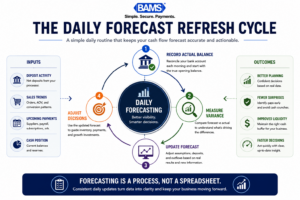
A forecast becomes more accurate when it is continuously updated with real data.
Action: Every business morning (or the first 15 minutes of your finance block), complete these three tasks:
- Record yesterday’s actual bank closing balance in the “Actual Cash Balance” column.
- Calculate the variance between your forecast and the actual number.
- Update the next 7 days of your forecast based on any new information (a large order, a delayed supplier payment, an unexpected refund batch).
This rolling refresh is what separates a living forecast from a static spreadsheet. Improving forecasting accuracy remains a priority for finance teams because even small forecasting errors can affect purchasing, payroll, and working capital decisions. Daily deposits demand daily reconciliation.
Common failure: Skipping reconciliation on weekends or after holidays. Deposits may not land on non-business days, but outflows (especially automated ones) still process. Check Monday morning for any weekend surprises.
Step 7: Integrate Faster Funding Into Restocking Decisions
Action: Now that your forecast reflects daily deposit timing, use it to make restocking decisions with precision instead of padding.
Here’s the practical shift: under a 3-5 day settlement cycle, you needed to carry a larger cash buffer because revenue from Monday through Wednesday was invisible to your bank account until Friday. With next-day funding, Monday’s revenue is available Tuesday. That means you can place supplier orders earlier, negotiate better terms by paying faster, or take advantage of early payment discounts.
For eCommerce managers using a processor like BAMS, which offers next-day funding with a 9 PM EST cutoff, this means transactions processed up to 9 PM are deposited the following business day. Your forecast should reflect this specific cutoff when estimating which day’s sales land in which day’s deposit. If you’re still on a processor with a 3-day hold, the math changes significantly, and switching to next-day funding may be the single highest-impact change you can make to your cash flow management.
Checkpoint: Run a scenario in your forecast where you move a typical restocking order 2 days earlier. Does your closing balance stay above your minimum threshold every day? If yes, you’ve unlocked reinvestment speed that was previously impossible.
Step 8: Build a Variance Tracking Dashboard
Action: Add a summary tab to your spreadsheet that tracks weekly forecast accuracy. For each completed week, calculate:
- Average daily variance (in dollars and as a percentage of forecasted balance)
- Largest single-day miss (which day, which direction, and why)
- Inflow accuracy (total forecasted inflows vs. actual)
- Outflow accuracy (total forecasted outflows vs. actual)
A one-day delay in a large inflow or outflow can materially affect weekly cash decisions. Tracking variance by category (inflows vs. outflows) tells you where your model is weakest so you can tighten the right inputs.
Target: Aim for weekly variance under 10%. If you’re consistently above that, the problem is almost always in one of three places: inflow estimates are too optimistic, a recurring outflow isn’t captured, or your settlement lag assumption is wrong.
Configuration and Customization
Variables You Should Adjust for Your Business
- Settlement lag (default: 1 day): Change this to match your actual processor timing. If you use multiple processors, track each separately.
- Minimum cash threshold (must-change): Set this to the amount you need to cover 5 days of outflows without any inflows. This is your safety floor. There is no universal default because it depends on your burn rate.
- Forecast horizon (default: 13 weeks): 13 weeks is standard for operational planning. Extend to 26 weeks if you have seasonal inventory cycles that require longer lead times.
- Refresh cadence (default: daily): Daily is recommended for the first 2 weeks of your forecast. Weeks 3-13 can refresh weekly unless you operate in a high-volatility category.
- Refund rate (default: your 90-day average): If you’re launching a new product or running aggressive promotions, increase this by 20-30% as a buffer.
Safe defaults vs. must-change: Settlement lag and minimum cash threshold are must-change settings. Using someone else’s numbers here will break your forecast immediately. The other variables have reasonable defaults you can refine over time.
Verification and Testing
Test procedure: Run your new forecast model in parallel with your actual bank balance for 14 days before making any spending decisions based on it. Each morning, compare your forecasted closing balance to your actual closing balance from the previous day.
Success definition: Your daily forecast is within 5% of the actual balance on at least 10 of the 14 test days. If you hit this threshold, the model is reliable enough to inform restocking and payment timing. FedNow has further accelerated payment settlement by enabling participating financial institutions to exchange funds in real time, 24 hours a day, 7 days a week.
Edge cases to verify:
- Holiday weekends: Deposits don’t land on bank holidays. Confirm your model skips non-business days for inflows but still captures automated outflows.
- Large promotional days: Test against a recent sale event. Did your model capture the spike and the corresponding deposit timing?
- Refund batches: If your processor batches refunds separately from sales deposits, verify these are modeled as outflows on the correct day.
Common Errors and Fixes
Error: Forecast Shows Cash Available, but Bank Balance Is Lower
Symptom: Your spreadsheet says you have $15,000 available, but your bank shows $11,000.
Cause: You’re forecasting gross revenue instead of net deposits. Processing fees, chargebacks, and refunds were deducted before the deposit hit your account.
Fix: Always use net deposit amounts from your processor export. If you want to track fees separately, add a “Processing Fees” outflow line.
Error: Deposits Appear a Day Later Than Expected
Symptom: Tuesday’s forecasted deposit doesn’t appear until Wednesday.
Cause: Transactions processed after your processor’s batch cutoff time roll into the next business day’s settlement. If your cutoff is 9 PM EST and you have West Coast customers buying at 7 PM PST (10 PM EST), those sales settle a day later.
Fix: Adjust your settlement lag for transactions near the cutoff. Alternatively, review why funding can take longer than expected and confirm your batch settings are optimized.
Error: Weekly Variance Spikes Every Other Week
Symptom: Your forecast is accurate one week, then off by 15%+ the next.
Cause: Biweekly payroll or a recurring supplier payment isn’t entered on the correct dates.
Fix: Audit your outflow calendar. Biweekly events are easy to misplace by a day or skip entirely. Set calendar reminders to verify these entries.
Error: Opening Balance Drifts Over Time
Symptom: Your forecast was accurate in week 1 but is now consistently off by a growing amount.
Cause: You’re carrying forward the forecasted closing balance instead of resetting to the actual reconciled bank balance each day.
Fix: Every morning, overwrite the opening balance with your actual bank balance. This prevents small daily errors from compounding into large weekly errors.
Next Steps and Extensions
Once your 13-week daily forecast is running reliably, consider these extensions:
- Scenario modeling: Duplicate your forecast and create “best case” and “worst case” versions by adjusting inflow estimates by +/- 20%. Use these to stress-test large purchasing decisions.
- Automated data feeds: Connect your eCommerce platform and bank account to your spreadsheet (or a tool like Google Sheets with API integrations) to reduce manual data entry.
- Invoice acceleration: If part of your revenue comes from B2B invoicing, explore how emailed invoices with built-in payment links can tighten the gap between invoice sent and cash received, further improving your real-time financial insights.
The goal is a forecast that requires less manual effort over time while becoming more accurate. Start with the manual process outlined here, prove the model works, then automate the inputs one by one.
Frequently Asked Questions
What is a cash flow acceleration strategy?
A cash flow acceleration strategy is any deliberate action that shortens the time between earning revenue and having usable cash in your bank account. For eCommerce operators, the most impactful lever is switching to a payment processor that offers next-day or same-day funding. Other tactics include tightening return windows, sending invoices with embedded payment links, and negotiating longer payment terms with suppliers to reduce outflow pressure.
How can businesses improve cash flow forecasting with real-time data?
The key is reducing the lag between a transaction happening and that data appearing in your forecast. Start by reconciling your bank balance daily (not weekly) and using net deposit data from your processor rather than top-line revenue from your eCommerce platform. If your processor provides same-day or next-day deposits, your forecast can operate on nearly real-time financial insights, which means restocking and ad spend decisions are based on yesterday’s actual numbers rather than last week’s estimates.
Why does switching to next-day funding break my existing forecast?
Your existing forecast was built around a 3-5 day settlement assumption. It expects cash to arrive on Thursday for Monday’s sales. When funding accelerates to next-day, cash arrives Tuesday instead. Your model underestimates early-week liquidity and overestimates late-week liquidity. The fix is recalibrating your settlement lag variable and switching from weekly to daily time buckets in your forecast.
How often should I refresh my cash flow forecast?
If you receive daily deposits, refresh daily for at least the first two weeks of your forecast horizon. For weeks 3 through 13, a weekly refresh is sufficient unless your business is highly seasonal or you’re running large promotions. The daily refresh takes about 15 minutes once your template is built and is the single most effective way to keep variance low.
What’s the biggest mistake eCommerce managers make when forecasting cash flow?
Using gross revenue instead of net deposits. Your payment processor deducts fees, chargebacks, and refunds before depositing funds. If you forecast based on your Shopify or WooCommerce sales dashboard, you’ll consistently overestimate available cash. Always pull net deposit data directly from your processor’s reporting tools.
Which payment solutions can help reduce processing fees and improve cash flow?
Look for processors that offer transparent interchange-plus pricing (so you can see exact costs per transaction), next-day funding (to eliminate the cash-in-transit gap), and proactive chargeback defense (to reduce revenue lost to disputes). Reducing your effective processing rate by even 0.3% can free up meaningful cash over a quarter, especially at higher transaction volumes.