
Cash Flow Forecasting for Same-Day Deposits
Last Updated on October 7, 2026 by Dimitri Akhrin
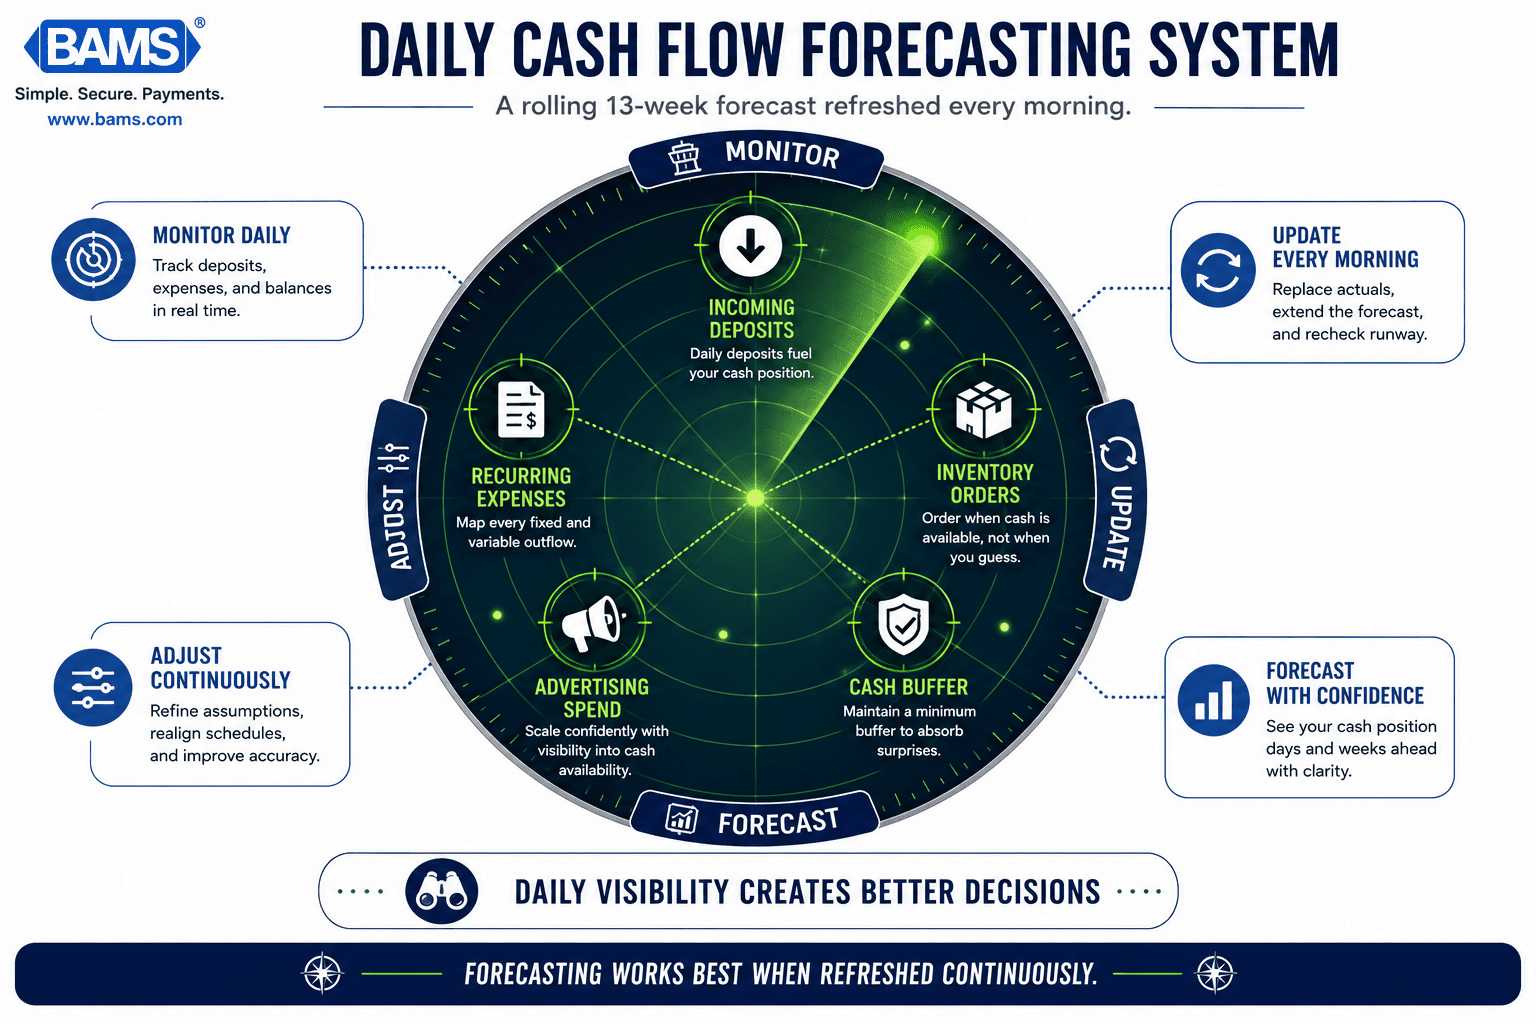
Rebuild your forecasting model around daily deposit cycles with a rolling 13-week spreadsheet you refresh every morning
Learn how to build a daily cash flow forecasting model calibrated for same-day deposits. This step-by-step tutorial replaces weekly settlement estimates with a rolling 13-week forecast that keeps variance under 5%.
TL;DR
- Daily deposits break old forecasting models – When settlement timing shrinks from 3-5 days to same-day or next-day, your batch-based forecast produces inaccurate cash projections. You need to rebuild at the daily level.
- Build a 13-week rolling forecast updated every morning – Use 90 days of deposit history to calculate day-of-week averages, map every recurring outflow to its exact date, and replace forecasts with actuals each day. Target under 5% variance.
- Align purchasing cycles to your strongest cash days – With daily visibility into your cash position, you can place smaller, more frequent inventory orders on days when your ending balance is highest, reducing overstocking risk and freeing up capital.
- Set a cash buffer threshold and automate alerts – Calculate 5 days of average outflows as your minimum balance. Use conditional formatting to flag any future day that dips below that line, giving you weeks of lead time to adjust.
- Track accuracy weekly with MAPE – Measure your forecast error every Friday. If it exceeds 10%, revisit your baseline period or audit your outflow mapping. Consistent tracking is what turns a spreadsheet into a reliable decision-making tool.
What You Will Build: A Daily Cash Flow Forecasting Model
By the end of this tutorial, you will have a working cash flow forecasting model calibrated for same-day or next-day deposit cycles. Instead of estimating weekly settlement windows, your spreadsheet (or tool of choice) will ingest daily deposit data, align outflows to actual cash availability, and give you a rolling 13-week forecast you can refresh every morning.
Your success criteria are simple. When you compare your forecasted available cash to your actual bank balance at the end of any given day, the variance should stay under 5%. You will also be able to pinpoint the exact day you can place a restocking order or increase ad spend, rather than guessing based on a 3-to-5-day settlement lag that no longer exists.

The goal isn’t predicting the future perfectly. It’s improving visibility every day.
Prerequisites and Setup
Before you start, confirm you have the following in place. Missing any one of these will stall your progress.
- A spreadsheet tool (Google Sheets, Excel, or Airtable). Templates are not required; you will build from scratch.
- Access to your payment processor dashboard with deposit history for the last 90 days minimum.
- Your bank account transaction feed, either via CSV export or a live connection through your accounting software (QuickBooks, Xero, etc.).
- A list of recurring outflows: supplier invoices, payroll dates, ad platform billing cycles, SaaS subscriptions, shipping costs.
- 30 minutes for initial setup, then 5-10 minutes per day for ongoing updates.
Potential blocker: If your processor still batches settlements every 2-3 days, your deposit data will have gaps. This tutorial assumes you receive deposits daily (same-day or next-day). If you are still on a multi-day settlement cycle, consider switching before rebuilding your model.
Why Your Old Forecasting Model Breaks with Daily Deposits
Most eCommerce cash flow models are built around a simple assumption: money arrives in chunks every few days. You sell on Monday through Wednesday, and a lump deposit hits your bank on Friday. Your forecast smooths revenue across those windows and schedules outflows against the expected arrival date.
When deposits start arriving daily, that assumption collapses. Revenue is no longer lumpy; it is granular. Your forecast suddenly has more data points, tighter feedback loops, and less tolerance for stale inputs. According to the Federal Reserve’s 2025 Small Business Credit Survey, managing cash flow and operating expenses remains a significant challenge for many businesses. As deposit timing becomes more predictable, forecasting models can be updated with greater accuracy and frequency.The stakes rise when your deposit cadence changes and your legacy timing assumptions stop matching reality.
The upside is significant. Daily deposits give you real-time financial insights into how much cash you actually have, not how much you think you will have in three days. The ACH Network continues to support electronic fund transfers between financial institutions, including Same-Day ACH capabilities that can improve deposit timing for eligible transactions. The tutorial below treats this as an operational recalibration, not a general budgeting exercise.
Step-by-Step: Rebuild Your Cash Flow Forecast for Daily Deposits
Step 1: Export and Map Your Last 90 Days of Deposit Data
Action: Log into your payment processor dashboard and export a CSV of all deposits for the past 90 days. Include the date, deposit amount, and any fees deducted at settlement.
Paste this data into a new spreadsheet tab labeled “Deposit History.” Create columns for: Date, Gross Sales, Processing Fees, Net Deposit, and Day of Week. Use a formula to auto-populate the day of week (in Google Sheets: =TEXT(A2,"dddd")).
Expected result: You should see 90 rows of daily deposit data. If you see gaps (days with no deposit), flag them. These gaps indicate days your processor did not settle, which matters for pattern recognition.
Common failure: Your export shows batch totals instead of daily breakdowns. Solution: check whether your dashboard has a “funding detail” or “settlement detail” report rather than a summary report.
Step 2: Calculate Your Daily Revenue Baseline
Action: In a new tab labeled “Baseline,” calculate the following from your deposit history:
- Average daily net deposit (total net deposits ÷ 90)
- Average net deposit by day of week (use
=AVERAGEIFfiltering on the day-of-week column) - Standard deviation of daily deposits (use
=STDEVon the net deposit column)
Why this matters: eCommerce revenue is not flat across the week. Mondays and Fridays often spike. Midweek may dip. Your old model hid these patterns inside multi-day settlement chunks. Now you can see them clearly.
Checkpoint: Your day-of-week averages should show visible variation. If every day is nearly identical, double-check that your data is not aggregated.
Step 3: Build the 13-Week Rolling Forecast Grid
Action: Create a new tab labeled “Forecast.” Build a grid with 91 rows (13 weeks × 7 days). Columns should be:
- Date
- Day of Week
- Forecasted Net Deposit (pre-populate with your day-of-week averages from Step 2)
- Actual Net Deposit (leave blank; you will fill this daily)
- Variance (formula: Actual minus Forecasted)
- Scheduled Outflows
- Projected Ending Cash
A 13-week rolling forecast is commonly used because it provides enough visibility to manage short-term liquidity needs while remaining practical to maintain and update regularly. With daily deposits, you can refresh it daily and gain a meaningful accuracy advantage.
Checkpoint: Your grid should extend exactly 91 days from today. The “Forecasted Net Deposit” column should auto-fill based on day-of-week averages.
Step 4: Map Every Recurring Outflow to Its Exact Date
Action: In a separate tab labeled “Outflows,” list every recurring expense with its exact calendar date (or day-of-month pattern). Include:
- Supplier payments and inventory restocking orders
- Payroll and contractor payments
- Ad platform charges (Google Ads, Meta, etc., typically bill on specific thresholds or dates)
- SaaS subscriptions (Shopify, email tools, analytics platforms)
- Shipping and fulfillment invoices
- Loan or credit card payments
Action: Use =VLOOKUP or =SUMIFS to pull the correct outflow amounts into the “Scheduled Outflows” column of your Forecast tab, matching on date.
Common failure: Forgetting variable outflows like ad spend. Solution: use a conservative estimate (your 90-day average daily ad spend) and adjust weekly as actuals come in.
Step 5: Add the Projected Ending Cash Formula
Action: In the first row of your Forecast tab, enter your current bank balance as the starting cash. Then, for each subsequent row, use this formula:
Projected Ending Cash = Previous Day’s Ending Cash + Today’s Forecasted Net Deposit – Today’s Scheduled Outflows
In Google Sheets, this looks like:
=G2 + C3 – F3
where G2 is yesterday’s ending cash, C3 is today’s forecasted deposit, and F3 is today’s outflows.
Expected result: You should see a daily cash balance projection stretching 91 days forward. Look for any day where the projected balance dips below your comfort threshold (we will define that in Step 7).
Checkpoint: Scroll through the entire 13 weeks. If the ending cash goes negative at any point, you have identified a future liquidity gap before it happens.
Step 6: Replace Forecasted Deposits with Actuals Each Morning
Action: Every morning, log into your bank account or accounting software. Enter yesterday’s actual net deposit into the “Actual Net Deposit” column for that date. The Variance column will auto-calculate.
Then, shift your forecast window forward by one day. Add a new row at the bottom of your 91-day grid for the date that just rolled into range, using your day-of-week average as the forecast.
Forecasts become significantly more useful when actual deposit activity is incorporated regularly rather than relying solely on historical estimates. This daily replacement step is where that principle becomes practice.
Time required: 3-5 minutes per day.
Common failure: Skipping weekends or holidays. Even if deposits do not arrive on non-business days, outflows (like auto-billed SaaS) still occur. Enter $0 for deposits on non-settlement days, but keep outflows accurate.
Step 7: Set Your Short-Term Cash Buffer Threshold
Action: Determine the minimum cash balance you need on any given day to operate without stress. A common approach: calculate your average daily outflow over 90 days, then multiply by 5. This gives you a five-day operating cushion.
Cash Buffer = Average Daily Outflow × 5
Action: Add conditional formatting to your “Projected Ending Cash” column. Highlight any cell that falls below your buffer threshold in red. This is your early warning system.
Expected result: Red cells tell you exactly which days in the next 13 weeks are at risk, giving you time to delay a discretionary purchase, accelerate a promotion, or adjust ad spend before the crunch arrives.
Step 8: Align Purchasing Cycles to Daily Deposit Availability
Daily deposits become more valuable when paired with daily forecasting.
Action: Review your supplier payment terms. If you have been scheduling inventory orders on a weekly or biweekly cycle based on old settlement windows, reconsider. With daily deposits, you can place smaller, more frequent orders timed to days when your projected cash balance is strongest.
Look at your Forecast tab. Identify the 2-3 days each week where your ending cash is highest (typically the day after your strongest sales days). Schedule restocking orders on those days.
This is the core of cash flow acceleration strategies for eCommerce: you are not just getting paid faster, you are converting funding speed into a purchasing advantage. Smaller, more frequent orders also reduce the risk of overstocking and free up cash for other growth levers like advertising.
Checkpoint: After two weeks of this approach, compare your average daily ending cash to the prior month. It should be more stable (lower standard deviation) even if the total cash flow volume has not changed.
Step 9: Track Forecast Accuracy Weekly
Action: Every Friday, calculate your Mean Absolute Percentage Error (MAPE) for the week:
MAPE = AVERAGE(ABS(Actual – Forecasted) / Actual) × 100
Record this number in a running log. Your target is a MAPE under 10% within the first month. Under 5% is excellent and achievable after 6-8 weeks of daily refinement.
Why this matters:A daily cash flow forecast is described as vital for ensuring liquidity is sufficient to cover obligations for the immediate day or two. But a forecast is only as useful as its accuracy. Tracking MAPE tells you whether your model is improving or drifting.
Common failure: MAPE spikes after a promotional event or seasonal shift. Solution: after any major sale or campaign, update your day-of-week averages with the most recent 30 days of data to capture the new pattern.
Step 10: Automate Where Possible
Action: If you use QuickBooks, Xero, or a similar platform, check whether it supports automatic bank feed imports. Many do. Connect your bank feed so that actual deposit data flows into your accounting software without manual entry.
Then, set up a daily or weekly export from your accounting tool into your forecast spreadsheet. Some teams use Zapier or a simple script to automate this step entirely.
For the processor side, merchants using a provider like BAMS with next-day funding or same day funding can rely on a consistent deposit schedule (funds available by the next business morning), which reduces one of the biggest variables in the model: deposit timing unpredictability.
Checkpoint: After automation, your daily update time should drop from 5 minutes to under 2 minutes.
Configuration and Customization
Variables You Should Adjust
- Forecast horizon: 13 weeks is the standard. If your business has longer supplier lead times, extend to 16 or 20 weeks. If cash is tight, add a granular daily view for the first 2 weeks with weekly summaries for weeks 3-13.
- Baseline period: 90 days works for most businesses. If you are highly seasonal, use the same 90-day window from the prior year as a secondary reference.
- Buffer multiplier: Five days of average outflows is a safe default. Businesses with volatile ad spend or unpredictable supplier costs should increase this to 7-10 days.
- Processing fee assumption: Use your actual average processing fee percentage from Step 1. Do not use a generic industry number. If your fees change (new processor, new rate), update this immediately.
Settings You Must Change
- Deposit timing assumption: This is the entire point. Change your model from “deposits arrive every X days” to “deposits arrive daily.” If you leave the old assumption in place, your forecast will overestimate cash-on-hand variance.
- Outflow dates: Do not use approximate dates. Use exact dates from your billing statements. A one-day error on a $15,000 supplier payment creates a false liquidity gap (or hides a real one).
Verification and Testing
Test procedure: Run your forecast for two full weeks before making any operational decisions based on it. Each morning, record the forecasted ending cash for that day, then compare it to your actual bank balance at end of day.
Calculate the daily variance. If your variance exceeds 10% on more than two days in a single week, your baseline averages or outflow mapping need adjustment. Revisit Steps 2 and 4.
Edge cases to verify:
- Weekends and bank holidays: Deposits may not settle. Confirm your model shows $0 inflow on non-settlement days.
- Refund-heavy days: If you process a large batch of refunds, your net deposit may be negative. Your model should handle negative values in the deposit column without breaking the ending cash formula.
- Promotional spikes: After a flash sale, your day-of-week average will underestimate deposits. Manually override the forecast for known promotional days.
Common Errors and Fixes
Error: Projected cash balance drifts increasingly negative over time
Symptom: By week 6-8 of the forecast, projected ending cash is deeply negative, even though your business is profitable.
Cause: You have included outflows that are not truly recurring, or you have double-counted an expense. Quarterly tax payments entered as monthly payments are a frequent culprit.
Fix: Audit your Outflows tab. Verify each line item against actual bank statements for the last 3 months.
Error: Actual deposits consistently exceed forecast
Symptom: Your variance column shows positive numbers almost every day.
Cause: Your 90-day baseline includes a period of lower sales (a slow season or a period before a growth initiative kicked in). The average is dragging your forecast down.
Fix: Shorten your baseline to 30 days, or use a weighted average that gives more recent weeks higher influence.
Error: Forecast is accurate for deposits but ending cash is still wrong
Symptom: Deposit forecasts are within 5%, but the ending cash number is off by 15% or more.
Cause:Unreconciled cash accounts and delayed posting of entries in your ERP are common threats to cash data accuracy. An outflow hit your bank that is not in your model.
Fix: Reconcile your bank statement against your Outflows tab weekly. Add any missing charges. Common culprits: annual subscription renewals, one-time equipment purchases, or unexpected chargeback debits.
Error: Model breaks on refund-heavy days
Symptom: The ending cash formula produces unexpected results or errors when the net deposit is negative.
Cause: Your formula does not account for negative inflows.
Fix: Ensure your “Projected Ending Cash” formula uses addition (Previous Cash + Net Deposit), not a conditional that skips negative values. A negative deposit is simply a subtraction and should flow through naturally.
Error: You forget to shift the forecast window forward
Symptom: After a few weeks, your forecast only covers 8-9 weeks ahead instead of 13.
Cause: You are replacing forecasted values with actuals but not appending new rows at the end.
Fix: Add a reminder to your daily update checklist: “Add new row for day 91.” Better yet, pre-populate the grid 26 weeks out and let it naturally roll. Rolling forecasts are preferred over static ones because they adjust more rapidly to changing conditions.
Next Steps and Extensions
Once your daily forecast is stable (MAPE under 5% for three consecutive weeks), you can extend it in several ways:
- Scenario modeling: Duplicate your Forecast tab and create “best case” and “worst case” versions by adjusting deposit forecasts ±15%. Use these to stress-test inventory decisions before committing capital.
- Ad spend optimization: Cross-reference your highest-deposit days with your ad platform’s ROAS data. Increase spend on days where both cash availability and return are strongest.
- Supplier negotiation leverage: With a reliable daily forecast, you can confidently offer suppliers faster payment in exchange for discounts, because you know exactly when the cash will be in your account.
For a deeper look at how deposit timing shapes your entire cash flow model, read Streamline Payment Processing: Your Cash Flow Model Is Wrong.
Frequently Asked Questions
What is a cash flow acceleration strategy?
A cash flow acceleration strategy is any operational change that gets cash into your bank account faster so you can reinvest it sooner. For eCommerce businesses, the most impactful lever is often reducing the settlement delay from your payment processor. Moving from a 3-to-5-day funding window to same-day or next-day deposits eliminates dead time where your revenue is inaccessible, letting you restock inventory, fund ad campaigns, or cover obligations without dipping into credit.
How can businesses improve cash flow forecasting with real-time data?
Connect your bank feeds and payment processor data directly to your forecasting model. Instead of updating your forecast weekly with estimated settlement amounts, pull actual daily deposit figures each morning. This gives you real-time financial insights into your true cash position and lets you spot variances immediately. Pairing live data with a rolling 13-week forecast grid keeps your projections grounded in what is actually happening, not what you assumed last week.
How often should I update my cash flow forecast?
Breaking forecasts into shorter periods like daily or weekly improves practical accuracy. If you receive daily deposits, update your forecast every morning. The process takes under 5 minutes once your model is set up: enter yesterday’s actual deposit, check for unexpected outflows, and scan the next 7-14 days for any red flags. Weekly updates are the minimum; daily is the standard when your deposits arrive daily.
Why does switching to daily deposits break my existing forecast?
Most forecasting models assume revenue arrives in batches every few days. Formulas, timing assumptions, and outflow scheduling are all built around that cadence. When deposits start arriving daily, you get 5-7 data points per week instead of 1-2. Your old model either cannot accommodate the granularity or produces misleading averages. The fix is rebuilding the model from the deposit level up, as outlined in this tutorial.
What is a good accuracy target for a daily cash flow forecast?
Aim for a Mean Absolute Percentage Error (MAPE) under 10% in your first month, and under 5% after 6-8 weeks of daily refinement. Track your MAPE every Friday by comparing forecasted versus actual ending cash for each day of the week. If accuracy stalls, revisit your baseline averages and outflow mapping. Seasonal shifts and promotional events will temporarily spike your error rate, so recalculate your baselines after major sales events.
Which payment solutions can help reduce processing fees while improving deposit speed?
Look for a merchant services provider that offers both transparent pricing and fast funding. Many processors force you to choose between lower rates and faster deposits. Providers like BAMS offer next-day funding alongside competitive processing rates, so you do not sacrifice one for the other. When evaluating options, ask specifically about the settlement cutoff time, per-transaction fees, and whether faster funding costs extra.


