

How to Calculate Your Effective Processing Rate
Last Updated on June 24, 2026 by Dimitri Akhrin
A statement audit framework that reveals hidden B2B fees your processor won’t flag for you
Learn how to calculate your effective processing rate, verify Level 2/3 qualification gaps, and identify the exact line items inflating your B2B processing costs. Includes a repeatable quarterly audit framework using your existing statements.
TL;DR
- Your effective processing rate is the only honest cost metric – Calculate it by dividing total fees by total sales volume. If it’s above 3.0% and you process B2B transactions, you likely have qualification gaps costing you thousands annually.
- “Level 2/3 enabled” doesn’t mean Level 2/3 qualified – Check your statement’s interchange breakdown for category names. If commercial card transactions land in “Standard” or “EIRF” categories instead of Level II/III categories, the required data isn’t being passed correctly.
- Ancillary fees add up fast – PCI fees, statement fees, batch fees, and vaguely labeled charges can add 0.1% to 0.3% to your effective rate. Cross-reference every fee against your original agreement and dispute anything that wasn’t included.
- Negotiate with data, not complaints – Build a one-page brief showing your effective rate, specific downgraded transactions with dollar impact, and disputed fees. Processors respond to documented evidence, not general dissatisfaction.
- Audit quarterly, not once – Interchange tables change, processors add fees, and your card mix evolves. A single audit saves money, but regular reviews prevent cost drift from erasing your gains.
Guide Orientation: What This Covers and Who It’s For
This guide teaches you how to find the hidden fees inflating your B2B processing costs by reading your own statements, not by trusting your processor’s sales pitch. If you manage eCommerce payments for a business with 10 to 50 employees and process a meaningful share of B2B or high-ticket card transactions, this is written for you.
By the end, you’ll understand how to calculate your effective processing rate, verify whether your transactions actually qualify for Level 2/3 optimization, and identify the specific line items where money leaks out of your margins. You’ll also have a repeatable framework for auditing statements on a quarterly basis.
This guide does not cover enterprise-scale payment orchestration, multi-acquirer strategies, or switching platforms. It focuses entirely on what your current data reveals and what you can do about it without overhauling your stack.
Why Hidden Fees in B2B Merchant Services Cost More Than You Think
Most eCommerce managers review their processing statements the same way they review utility bills: glance at the total, confirm it’s roughly in range, and move on. That habit is expensive. Federal Reserve interchange fee data demonstrates how interchange qualification differences can materially affect total processing costs, making effective rate analysis essential for B2B merchants.
The gap between your quoted rate and your effective rate is where hidden fees live. Interchange downgrades, misapplied surcharges, PCI compliance markups, and phantom “optimization” fees can push a seemingly competitive 2.4% rate well above 3.2%. For a business processing $500,000 annually in B2B card volume, that 0.8% gap represents $4,000 in avoidable cost every year.
The problem is compounding. As your B2B volume grows, so does the dollar impact of every unoptimized transaction. Meanwhile, processors have little incentive to flag these issues because the fees flow to them. The cost of inaction isn’t dramatic. It’s a slow, steady drain on margins that most teams never quantify because they never look.
Recent industry shifts make this more urgent. Card network assessment fees adjust periodically, interchange categories evolve, and processors quietly add line items during contract renewals. If you haven’t audited your statements in the last six months, you’re working with outdated assumptions about what you pay.

Core Concepts: The Language of Processing Cost Analysis
Effective Processing Rate vs. Quoted Rate
Your quoted rate is what your processor advertised. Your effective processing rate is what you actually pay. Calculate it by dividing total processing fees by total sales volume, then multiplying by 100. Typical credit card processing fees range from 1.5% to 3.5% when $691.11 in total fees were divided by $11,132.58 in sales, a number that would shock anyone who signed up expecting 2.9%.
A reasonable benchmark for eCommerce effective rates falls between 2.3% and 3.5%, depending on business type, card mix, and pricing model. If your effective rate exceeds 3.5% and you process significant B2B volume, qualification failures are almost certainly a factor.
Interchange-Plus Pricing
Interchange-plus pricing separates the base interchange fee (set by card networks) from your processor’s markup. This model offers transparency because you can see exactly what the network charges versus what your processor adds. It’s the pricing model best suited for identifying hidden fees because every component is visible, if you know how to read it.
Level 2 and Level 3 Data Qualification
Card networks like Visa and Mastercard offer lower interchange rates on B2B transactions when merchants submit enhanced data: tax amounts and customer codes for Level 2, plus line-item detail (product codes, quantities, freight amounts) for Level 3. The savings are real, often 0.3% to 0.5% per transaction or more. Visa interchange reimbursement fee schedules show how enhanced commercial card data can qualify transactions for lower interchange categories when the required fields are transmitted correctly. The catch: many processors claim to support Level 2/3 optimization but don’t actually pass the required data fields, meaning your transactions downgrade to higher-cost categories silently.
Interchange Downgrades
A downgrade occurs when a transaction fails to meet the criteria for its optimal interchange category. Common causes include missing data fields, late settlement, or incorrect transaction codes. Downgrades are the single largest source of hidden fees in merchant services for B2B sellers, and they rarely appear with clear labels on your statement.
The Audit Framework: Four Phases of Statement Verification
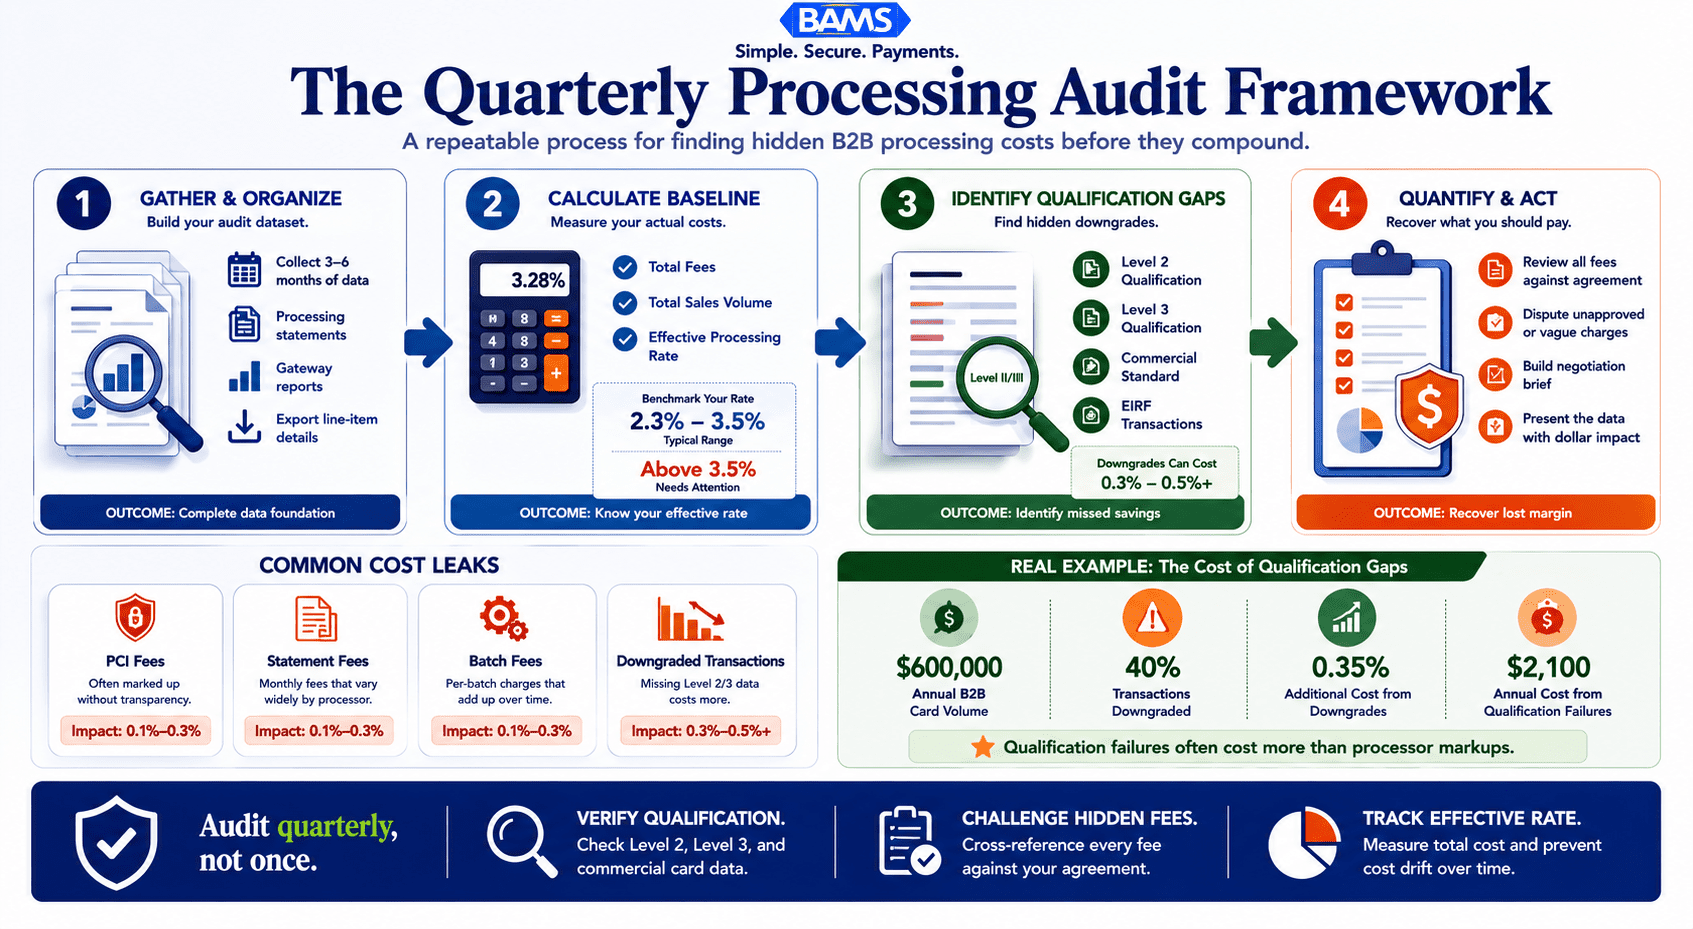
This guide follows a four-phase framework designed to move you from raw data to actionable decisions. Each phase builds on the previous one, and the entire process can be completed in a single focused session with three to six months of statements.
- Phase 1: Gather and Organize — Collect the raw materials (statements, exports, gateway logs) and structure them for analysis.
- Phase 2: Calculate Your Baseline — Determine your actual effective processing rate across all transaction types.
- Phase 3: Identify Qualification Gaps — Find where Level 2/3 data is missing, where downgrades occur, and where fees don’t match your pricing agreement.
- Phase 4: Quantify and Act — Assign dollar values to each gap and build a prioritized action plan (negotiate, fix data, or escalate).
These phases treat cost reduction as a data verification exercise. You’re not comparing processor marketing materials. You’re reading your own financial records to find discrepancies between what was promised and what’s actually happening.

The merchants who pay the least are not the ones with the cheapest quote. They are the ones who audit regularly.
Step-by-Step: How to Audit Your B2B Processing Statements
Step 1: Collect Three to Six Months of Complete Statements
Objective: Assemble every document needed to calculate fees accurately across a representative time period.
Request full monthly processing statements from your processor, not summary invoices. You need the detailed version that shows every interchange category, every assessment fee, and every ancillary charge. If your processor provides online portal access, download the PDF statements and any CSV exports available. Also pull transaction-level reports from your payment gateway, as these will be critical for cross-referencing in later steps.
Three months is the minimum for a meaningful audit. Six months is better because it captures seasonal variation in card mix and order volume. Industry guidance recommends collecting statements alongside data on volume, average ticket size, card mix, refunds, chargebacks, and ancillary fees.
What to avoid: Don’t rely on your processor’s verbal summary of fees. Don’t accept a single month’s data as representative. Don’t skip gateway-level exports, as they contain the transaction detail your statement summaries often obscure.
Success indicator: You have PDF statements and exportable data for at least three consecutive months, covering every fee category your processor charges.
Step 2: Calculate Your Effective Processing Rate
Objective: Establish one number that represents your true cost of processing, inclusive of every fee.
For each month, add up every fee on your statement: interchange charges, processor markup, assessment fees, gateway fees, PCI fees, batch fees, statement fees, and any other line items. Divide that total by your total sales volume for the same month. Multiply by 100. That’s your effective rate for that month.
Then calculate the average across all months in your sample. Your effective processing rate is the only number that matters when evaluating cost. A processor quoting 2.1% interchange-plus with 0.25% markup sounds attractive, but if your effective rate comes out to 3.4%, something between the quote and reality is adding cost.
Compare your result to benchmarks. Typical credit card processing fees range from 1.5% to 3.5% plus per-transaction flat fees. For eCommerce specifically, 2.3% to 3.3% is a common range. If you’re above that range and you process B2B transactions, qualification failures are the most likely culprit.
What to avoid: Don’t exclude any fee category from your calculation. Some merchants accidentally omit PCI fees, gateway fees, or chargeback fees, which makes the effective rate look artificially low. The point is total cost, not selective cost.
Success indicator: You have a single effective rate number for each month and a multi-month average. You can compare it to your quoted rate and to industry benchmarks.
Step 3: Map Your Interchange Categories and Spot Downgrades
Objective: Determine whether your B2B transactions are qualifying at the optimal interchange tier or silently downgrading to more expensive categories.
This is where most eCommerce managers discover the real story. Open your detailed statement and find the interchange breakdown section. Each transaction or batch of transactions is assigned an interchange category (e.g., “Commercial Level III,” “Commercial Standard,” “EIRF”). The category names vary by card network, but the pattern is consistent: Level 3 categories carry the lowest rates, and “Standard” or “EIRF” (Electronic Interchange Reimbursement Fee) categories carry the highest.
Look specifically for B2B transactions (commercial cards, purchasing cards, corporate cards) and note which interchange categories they landed in. If you see large volumes in “Commercial Standard,” “Commercial Data Rate I” (without corresponding Level II or III categories), or any category with “EIRF” or “Standard” in the name, those transactions downgraded. They failed to pass the data required for a lower rate. Mastercard commercial card acceptance research highlights the growing importance of commercial card optimization and enhanced transaction data for merchants seeking lower processing costs.Cross-reference with your gateway logs.
For each downgraded transaction, check whether the gateway actually transmitted the Level 2 fields (tax amount, customer code) and Level 3 fields (line-item detail, product codes, freight). If your gateway didn’t send the data, the downgrade is a technical gap. If the gateway sent it but the processor didn’t pass it to the network, the downgrade is a processor failure. This distinction matters enormously for your next conversation.
What to avoid: Don’t assume that because your processor “supports” Level 2/3, your transactions are actually qualifying. Support and execution are different things. Also, don’t ignore small-dollar downgrades. They compound across hundreds or thousands of transactions per month.
Success indicator: You have a list of interchange categories your B2B transactions are landing in, and you can identify which ones represent downgrades versus optimal qualification.
Step 4: Isolate Ancillary and Non-Interchange Fees
Objective: Identify every fee on your statement that isn’t interchange or processor markup, and determine whether each one is justified.
Beyond interchange and markup, your statement likely contains a constellation of smaller fees: PCI compliance fees, PCI non-compliance fees, gateway access fees, batch settlement fees, statement fees, regulatory product fees, network access fees, and more. Individually, these might look trivial ($5 here, $25 there). Collectively, they can add 0.1% to 0.3% to your effective rate.
Create a simple spreadsheet listing every non-interchange fee, its monthly amount, and whether it appears in your original processing agreement. Flag any fee that (a) wasn’t in your agreement, (b) has increased since you signed, or (c) appears under a vague label you can’t map to a specific service. For a detailed walkthrough of common offenders, the line-by-line audit guide covers each category with specific diagnostic steps.
Pay special attention to PCI fees. Some processors charge both a “PCI compliance fee” and a separate “PCI non-compliance fee” simultaneously, which is contradictory. Others charge a “regulatory product fee” that has no regulatory basis. These are pure margin additions disguised as mandatory costs.
What to avoid: Don’t dismiss small fees as immaterial. A $15 monthly statement fee and a $10 batch fee add $300 per year. Multiply by three or four such fees and you’re looking at over $1,000 annually in charges that may not be contractually required.
Success indicator: You have a complete inventory of non-interchange fees, each one tagged as contractual, questionable, or unjustified.
Step 5: Quantify the Gap Between Current and Optimal Costs
Objective: Assign a dollar value to every qualification failure and unjustified fee so you can prioritize actions by financial impact.
Take your list of downgraded transactions from Step 3. For each, estimate the difference between the interchange rate they actually paid and the rate they would have paid at the correct Level 2 or Level 3 category. Visa and Mastercard publish their interchange tables, and the difference between Commercial Standard and Commercial Level III can be 0.3% to 0.5% or more per transaction. Multiply that difference by the transaction volume in each downgraded category. This gives you your “qualification gap” in dollars.
Then total your unjustified ancillary fees from Step 4. Add the qualification gap and the ancillary fee total together. This is your recoverable cost: the amount you’re paying above what you should be paying under your current agreement and proper data qualification.
For many B2B eCommerce businesses processing $300,000 to $1,000,000 annually in commercial card volume, this number lands between $3,000 and $15,000 per year. It’s not a rounding error. It’s a line item that flows directly to your bottom line if corrected.
What to avoid: Don’t estimate conservatively to feel safe. Use the actual interchange tables and your actual transaction volumes. Underestimating the gap reduces your leverage in negotiations and delays action.
Success indicator: You have a single dollar figure representing your total recoverable cost, broken into qualification gaps and ancillary fee overcharges.
Step 6: Build Your Negotiation Brief and Take Action
Objective: Convert your audit findings into a structured document that drives specific outcomes with your processor (or informs a switch).
Organize your findings into a one-page brief with three sections: (1) your effective rate versus quoted rate, (2) specific interchange downgrades with dollar impact, and (3) ancillary fees you’re disputing. This isn’t a complaint letter. It’s a data-backed business case that demonstrates exactly where your processor’s execution doesn’t match their promise.
Contact your processor’s account management team (not general support) and present the brief. Ask three specific questions: Why are these transactions downgrading? What data fields are missing? What’s your timeline to fix it? If your processor can’t answer these questions clearly, that tells you something important about their Level 2/3 capabilities.
For the ancillary fees, request written justification for each one you’ve flagged. If a fee isn’t in your agreement or can’t be tied to a specific service, request its removal. Processors remove fees more often than merchants expect, but only when asked with documentation. The signals of margin leakage guide provides additional negotiation levers specific to B2B statements.
If your processor can’t resolve qualification gaps within 60 days, consider whether your current relationship is serving your business. A merchant services partner like BAMS focuses on transparent pricing and dedicated account management, which means qualification issues get flagged proactively rather than buried in statement fine print. That said, the audit you’ve just completed gives you leverage regardless of which processor you work with.
What to avoid: Don’t negotiate without your data brief. Vague complaints about “high fees” give processors room to deflect. Also, don’t accept promises without timelines. “We’ll look into it” is not a resolution.
Success indicator: You’ve delivered a specific, data-backed brief to your processor, received concrete answers about downgrade causes, and have a documented timeline for fee corrections or removals.
Practical Example: What a Qualification Gap Looks Like on a Real Statement
Scenario: Mid-Market B2B eCommerce Seller
Consider an eCommerce business processing $600,000 annually, with 40% of volume ($240,000) coming from commercial purchasing cards. Their processor quoted interchange-plus pricing at interchange + 0.30% + $0.10 per transaction.
On paper, this looks competitive. But when the eCommerce manager runs the effective rate calculation, total annual fees come to $19,800, producing an effective rate of 3.3%. That’s nearly a full percentage point above what the quoted rate implied for their transaction mix.
Where the Money Goes
Digging into the interchange breakdown reveals that 85% of their commercial card transactions are landing in “Commercial Standard” (approximately 2.95% + $0.10) instead of “Commercial Level III” (approximately 2.10% + $0.10). The difference: 0.85% per transaction on $204,000 in misqualified volume, totaling roughly $1,734 per year in avoidable interchange alone.
Additionally, the statement shows a $29.95 monthly “PCI Program Fee,” a $9.95 “Statement Fee,” and a $0.25 per-batch “Settlement Fee” charged daily. None of these appeared in the original agreement. Together, they add approximately $660 annually.
The Resolution
Armed with this data, the manager contacts their processor. The qualification failures trace back to their gateway not passing tax amount and line-item fields on commercial card transactions. The processor’s integration team hadn’t configured Level 3 data mapping during onboarding. After escalation, the technical fix takes three weeks. The ancillary fees are partially removed (the PCI fee is reduced, the statement fee is waived, the batch fee stays). Net annual savings: approximately $2,100, achieved without switching processors or platforms.
Common Mistakes and Pitfalls
Trusting the “Level 2/3 Enabled” label. Many processors and gateways advertise Level 2/3 support. Support means the system can accept the data. It doesn’t mean the data is being passed correctly on every transaction. Verification requires checking interchange categories on your statement, not reading marketing materials.
Auditing once and forgetting. Interchange tables change. Processors add fees. Your card mix shifts as your customer base evolves. A single audit is valuable, but quarterly reviews are what prevent cost drift from creeping back.
Focusing only on the rate. The processor’s markup rate is one component of cost. Interchange qualification, ancillary fees, and settlement timing all affect your total cost of payments. Optimizing only the markup while ignoring downgrades is like negotiating rent while ignoring utility bills.
Accepting vague processor responses. “We’ll optimize your account” isn’t a fix. Demand specifics: which data fields are missing, which interchange categories should your transactions qualify for, and what’s the expected timeline for correction.
What to Do Next
Start with one month’s statement. Calculate your effective rate. If it’s above 3.0% and you process B2B transactions, you almost certainly have qualification gaps worth investigating. That single calculation takes ten minutes and tells you whether a deeper audit is worth your time.
If the number surprises you, pull two more months and run through the full framework above. You don’t need to complete every step in one sitting. Even identifying your top three interchange downgrades gives you enough data to start a productive conversation with your processor.
Treat this guide as a reference, not a one-time checklist. Revisit it quarterly, especially after contract renewals or volume changes. The merchants who consistently pay the least aren’t the ones who found the cheapest processor. They’re the ones who verify their statements regularly and hold their processor accountable with data.
Frequently Asked Questions
What is interchange-plus pricing and how does it work?
Interchange-plus pricing separates the base interchange fee (set by Visa, Mastercard, or other card networks) from your processor’s markup. You pay the actual interchange rate for each transaction category, plus a fixed percentage and per-transaction fee from your processor. This model gives you visibility into both components, making it easier to identify whether high costs come from interchange downgrades or processor markups. It’s the most transparent pricing model available for B2B eCommerce merchants.
How do I know if my processor is actually qualifying transactions at Level 2 or Level 3?
Check your monthly processing statement’s interchange breakdown section. Look for category names like “Commercial Level II,” “Commercial Level III,” or “Purchasing Card Level III.” If most of your commercial card transactions appear under “Commercial Standard,” “EIRF,” or categories without a Level designation, they’re not qualifying. Cross-reference with your gateway logs to confirm whether the required data fields (tax amount, customer code, line-item detail) are being transmitted.
What are common hidden fees in merchant services that businesses should watch out for?
The most common hidden fees include PCI compliance and non-compliance fees charged simultaneously, monthly statement fees, batch settlement fees, gateway access fees, and vaguely labeled “regulatory product fees.” Individually they appear small, but they can collectively add 0.1% to 0.3% to your effective rate. Review your original processing agreement and flag any fee that wasn’t included at signing or that can’t be tied to a specific, identifiable service.
What is a good effective processing rate for eCommerce businesses?
For eCommerce, a reasonable effective rate benchmark is 2.3% to 3.3%, though this varies by card mix, average ticket size, and business type. B2B merchants processing commercial cards should aim for the lower end of this range if Level 2/3 data is being passed correctly. If your effective rate exceeds 3.5%, it’s worth auditing your statements for interchange downgrades and unjustified ancillary fees.
When is the best time to negotiate processing fees with your merchant services provider?
The best time is after you’ve completed a thorough statement audit with at least three months of data. You want to negotiate with specific findings: downgraded interchange categories, unjustified fees, and a calculated effective rate that demonstrates the gap between what you were quoted and what you’re paying. Contract renewal periods also provide leverage, but data-backed negotiation works at any point in your agreement.
Can I fix Level 2/3 qualification issues without switching processors?
Often, yes. Many qualification failures stem from technical configuration issues, such as your gateway not passing the required data fields to your processor. Contact your processor’s account management team with specific examples of downgraded transactions and ask which data fields are missing. If the issue is a gateway configuration gap, it can typically be resolved within a few weeks. If your processor lacks the technical capability to pass Level 3 data to the card networks, that’s a more fundamental problem that may require a change.


