How to Cut Chargeback Costs With Mobile Wallet Orders
Last Updated on July 23, 2026 by Dimitri Akhrin
Turn fewer payment disputes into lower per-transaction processing fees that compound across every order
Learn how chargebacks inflate your real cost per transaction and why mobile wallet orders change the equation. This guide connects dispute reduction to per-order processing savings that compound at high volumes.
TL;DR
- Chargebacks increase your true payment processing cost — Beyond lost revenue, chargebacks create additional operational expenses, dispute fees, and risk-related costs that raise the real cost of every transaction.
- Mobile wallet payments help reduce fraud exposure — Tokenized payment methods like Apple Pay and Google Pay use strong authentication and secure payment credentials that reduce exposure to stolen-card fraud while supporting more secure transactions.
- Proactive dispute management protects both revenue and margins — Preventing disputes before they become chargebacks reduces operational costs, preserves healthier chargeback ratios, and improves payment performance over time.
- Lower dispute rates create compounding financial benefits — Fewer chargebacks can improve effective processing costs, strengthen your negotiating position with processors, and support faster access to funds depending on your payment provider and risk profile.
- Start by measuring your effective cost per transaction — Looking beyond your quoted processing rate helps uncover hidden costs from disputes, interchange qualification, and payment operations so you know where optimization efforts will have the greatest impact.
Guide Orientation: What This Covers and Who It’s For
This guide shows you how reducing chargeback costs on mobile wallet orders translates directly into lower effective processing fees, not just recovered revenue. We connect two problems most eCommerce teams treat separately: dispute management and per-transaction cost optimization.
It’s built for eCommerce managers at established online businesses processing enough volume that small per-order savings compound into meaningful margin gains. If you run a team of 10 to 50 people and your payment processing line item keeps climbing, this is for you.
By the end, you’ll understand exactly how chargebacks inflate your real cost per transaction, why mobile wallet orders change that equation, and what steps to take so that fewer disputes become measurable savings on every order. We focus on the financial mechanics and decision frameworks, not on explaining what Apple Pay is or how to set up a payment gateway.
Why Chargeback Costs Matter More Than You Think
Chargebacks aren’t just a nuisance line item. They’re a multiplier that inflates every cost attached to a transaction. Every $1 lost to a chargeback now costs merchants between $3.75 and $4.61 when you factor in the original product cost, shipping, processing fees, dispute fees, and the operational time spent responding. That figure has risen 37% since 2021.
Mastercard notes that chargebacks create costs far beyond the original purchase amount, reinforcing why dispute prevention should be viewed as a financial optimization strategy rather than simply a fraud issue. As dispute volumes increase, merchants that reduce unnecessary chargebacks improve more than just revenue recovery—they strengthen their overall payment performance and reduce operational costs.
As digital wallet adoption continues to grow, more merchants have opportunities to benefit from tokenized payment credentials and stronger transaction authentication. This shift creates an opportunity: mobile wallet transactions carry built-in fraud protections that, when leveraged correctly, reduce your chargeback exposure and lower your effective cost per transaction.
The cost of ignoring this connection is straightforward. You keep paying dispute fees, absorbing inflated processing rates from high chargeback ratios, and missing the interchange advantages that tokenized mobile payments offer. Each month you delay, the gap between your current processing costs and your optimized costs widens.
Core Concepts: The Hidden Link Between Chargebacks and Processing Costs
The True Cost Multiplier
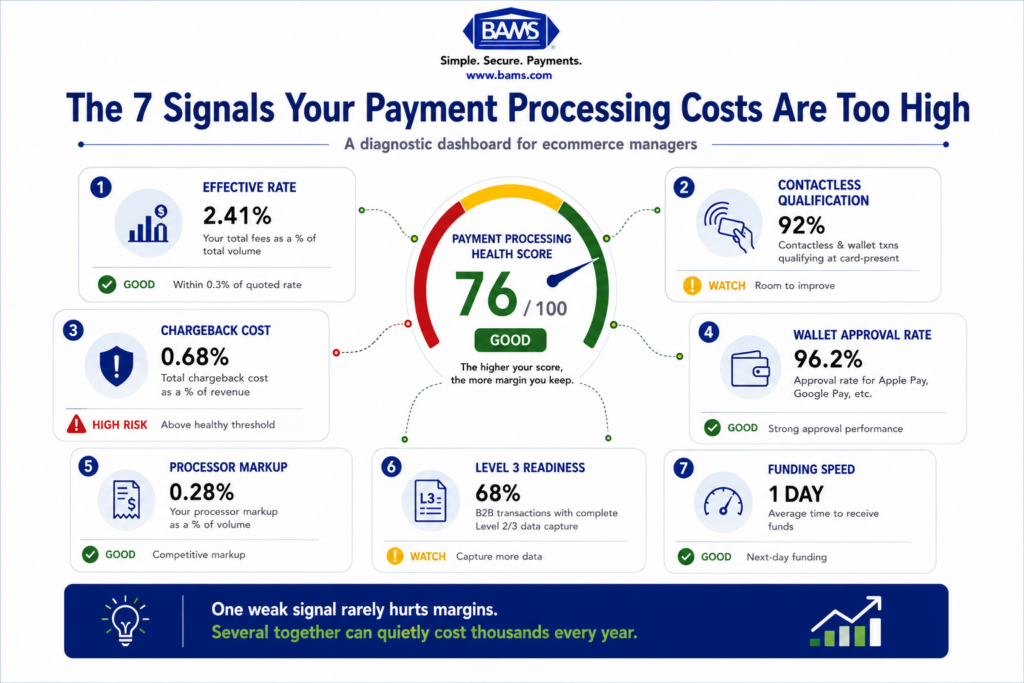
Most teams track chargebacks as a revenue recovery problem. You lost the sale, you lost the product, and you paid a $25 to $100 dispute fee. But the real damage is systemic. High chargeback ratios push you into monitoring programs with card networks, which carry additional monthly fees. They also affect your payment authorization rates, meaning more legitimate transactions get declined as your risk profile worsens.
Interchange Qualification and Mobile Wallets
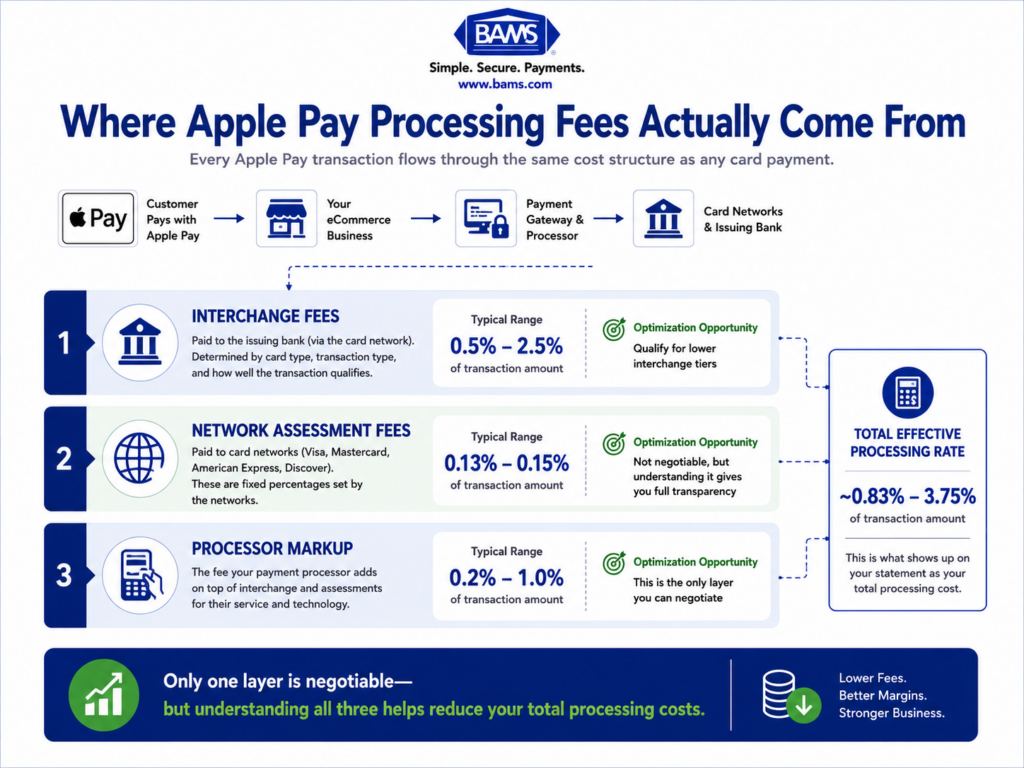
Every card transaction qualifies for a specific interchange tier based on how much data accompanies it and how secure the authentication method is. Mobile wallet transactions (Apple Pay, Google Pay, Samsung Pay) use device-level tokenization and biometric authentication. This means they often qualify for lower interchange categories than manually keyed card-not-present transactions. The difference can be 0.10% to 0.30% per transaction, which is significant at volume.
Effective Processing Cost vs. Stated Rate
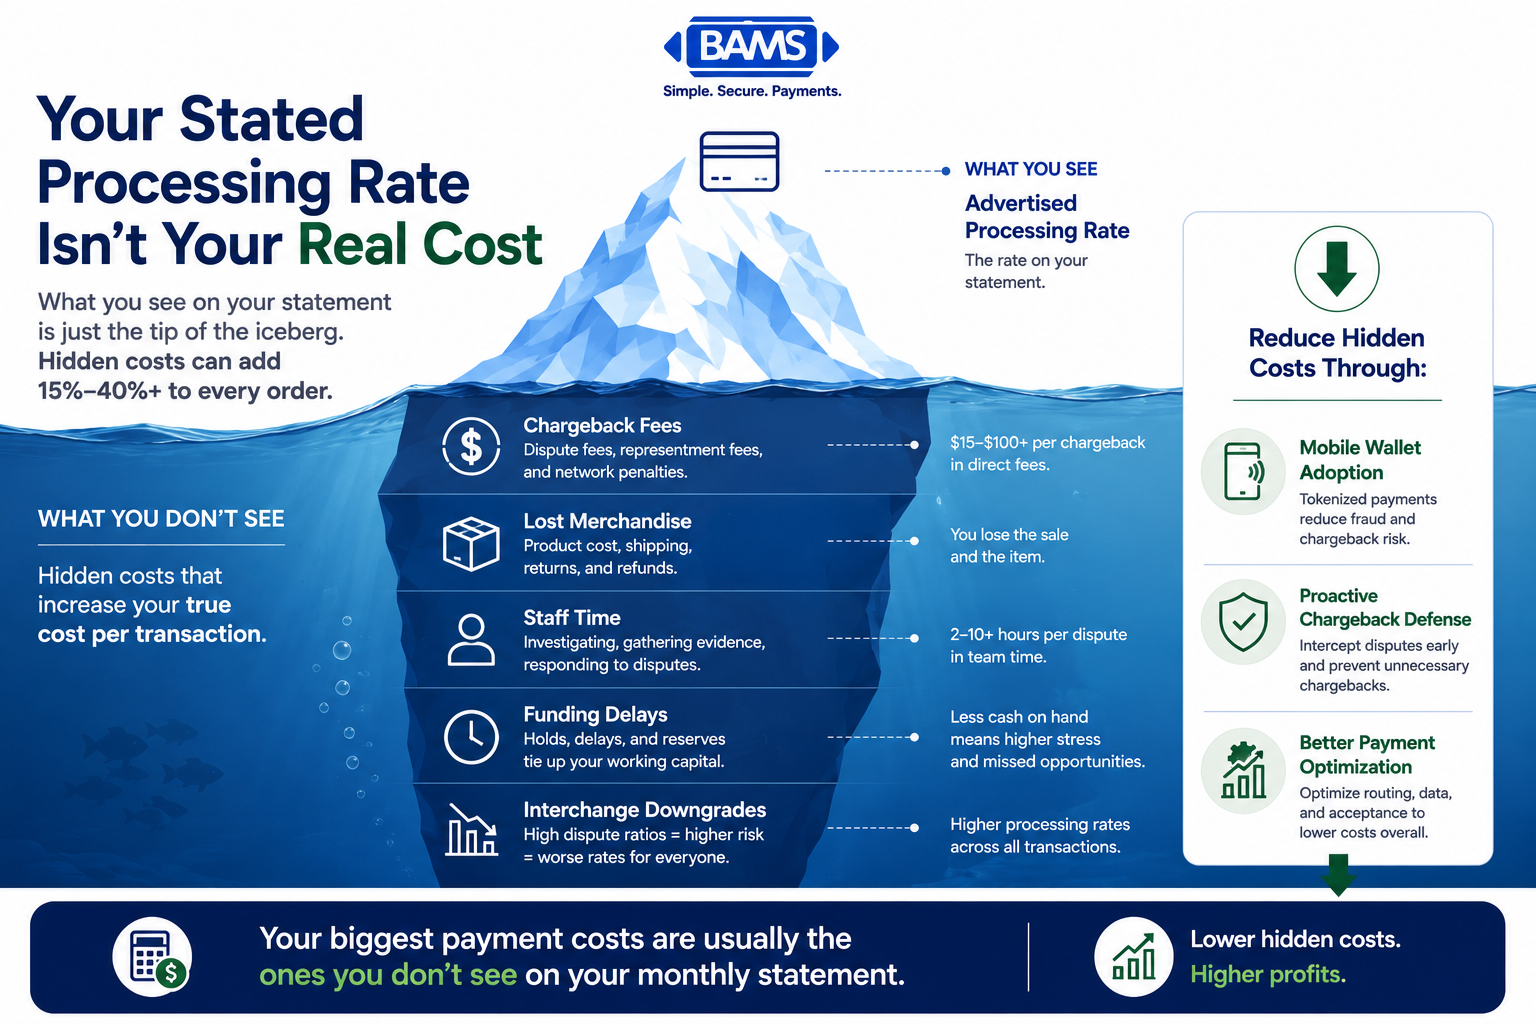
Your stated processing rate (say, 2.6% + $0.10) is not your real cost per transaction. Your effective processing cost includes interchange downgrades from incomplete data, chargeback fees and penalties, lost merchandise and shipping on disputed orders, and the operational cost of managing disputes. Reducing chargebacks doesn’t just save you the dispute fee. It lowers your effective rate across every transaction by keeping your risk profile clean and your interchange qualifications optimal.
Tokenization vs. Raw Card Data
Traditional card-not-present transactions transmit actual card numbers, which are vulnerable to interception and fraud. Mobile wallets replace card numbers with device-specific tokens (sometimes called MPANs, or Merchant Payment Account Numbers). These tokens are useless if stolen, which eliminates an entire category of fraud that drives chargebacks in eCommerce. Mastercard Developers explains how Device Primary Account Numbers (DPANs) and network tokenization protect payment credentials during digital wallet transactions.
The Framework: From Dispute Defense to Cost Optimization

Reducing chargebacks does more than recover lost sales. It creates a chain reaction of lower processing costs, improved cash flow, and stronger long-term profitability.
Most chargeback reduction advice treats disputes as isolated events to win or prevent. This guide uses a different framework: treating chargeback reduction as a per-transaction cost optimization lever that compounds across your entire order volume.
The framework has four phases that build on each other:
- Phase 1: Measure Your True Cost — Calculate your effective processing cost including chargeback damage, not just your stated rate.
- Phase 2: Shift Transaction Mix — Increase the proportion of orders processed through mobile wallets to capture interchange and fraud advantages.
- Phase 3: Build Proactive Dispute Defense — Implement systems that prevent chargebacks before they happen, not just respond after.
- Phase 4: Optimize the Feedback Loop — Use dispute data to refine fraud rules, improve checkout flows, and negotiate better processing terms.
Each phase reduces your effective cost per transaction. Together, they create a compounding effect where fewer chargebacks lead to better interchange qualification, which leads to lower rates, which improves your margin on every single order.
Step-by-Step Breakdown: Turning Fewer Chargebacks Into Real Savings
Step 1: Calculate Your Effective Processing Cost (Not Just Your Rate)
Objective: Know the actual dollar amount each transaction costs you, including chargeback-related losses, so you have a baseline to measure improvement against.
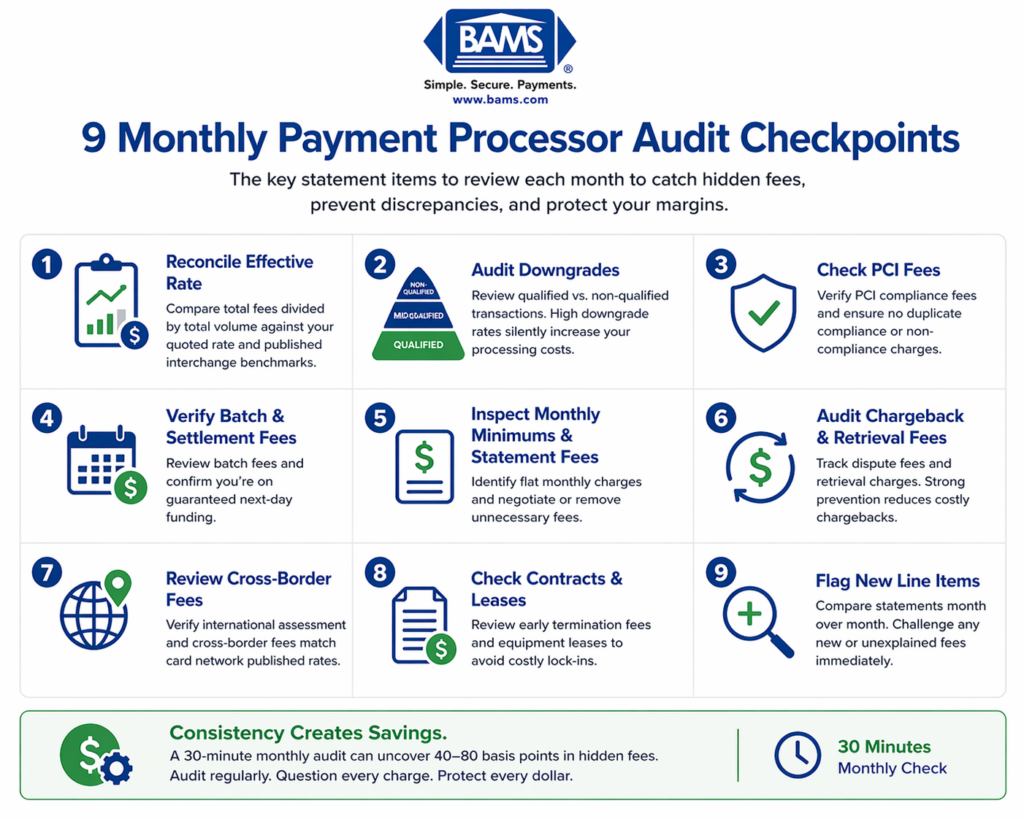
Pull your last 90 days of processing statements and dispute records. Add up your total processing fees, chargeback fees, dispute response labor costs (estimate hours spent times hourly rate), and the cost of goods and shipping on lost disputes. Divide that total by your number of transactions. That’s your effective cost per transaction.
For most eCommerce businesses, this number is 15% to 40% higher than the rate quoted on their processing agreement. The gap comes from interchange downgrades on transactions that don’t pass enough data, chargeback fees that get buried in monthly statements, and the invisible cost of staff time spent managing disputes.
Anti-patterns: Don’t rely on your processor’s summary dashboard alone. Many dashboards exclude dispute fees or categorize them separately. Don’t ignore the cost of goods lost to chargebacks, as this is often the largest single component. Don’t average across all payment methods; break out card-not-present, mobile wallet, and card-present transactions separately.
Success indicators: You have a single dollar figure for effective cost per transaction, broken out by payment method. You can identify which payment channels have the highest effective cost and which carry the most chargeback exposure.

The processing rate on your monthly statement is only the visible portion of your payment costs. Hidden expenses such as chargebacks, labor, and funding delays significantly increase the true cost of every transaction.
Step 2: Increase Mobile Wallet Adoption at Checkout
Objective: Shift a measurable percentage of your transaction volume to mobile wallet payments, capturing their inherent fraud protection and interchange advantages to improve mobile conversion rates.
More than about 5 billion people now use digital wallets, and these payment methods account for over 60% of global eCommerce transactions. Your customers already have the wallets. The question is whether your checkout experience makes them easy to use.
Start by auditing your checkout flow on mobile devices. Is Apple Pay or Google Pay presented as the first payment option, or buried below manual card entry? Research consistently shows that reducing friction at checkout increases adoption of faster payment methods. Place mobile wallet buttons above the fold on your payment page. Test one-tap checkout flows. Remove unnecessary form fields that discourage wallet use.
The interchange benefit is concrete. Mobile wallet transactions use tokenized credentials with biometric verification, which often qualifies them for more favorable interchange tiers than standard card-not-present transactions. On a $60 order, a 0.15% interchange improvement saves $0.09. At 50,000 monthly transactions with 30% wallet adoption, that’s $1,350 per month in interchange savings alone, before accounting for reduced fraud.
Anti-patterns: Don’t add mobile wallet options without testing the checkout flow on actual devices. A broken Apple Pay button is worse than no button at all. Don’t assume all customers will switch; focus on making the option visible and frictionless rather than forcing it. Don’t neglect Android users by only implementing Apple Pay.
Success indicators: Mobile wallet transaction share increases by at least 5-10 percentage points within 60 days. Average checkout completion time decreases on mobile devices. You see a measurable reduction in cart abandonment on mobile.
Step 3: Implement Proactive Chargeback Defense
Objective: Catch and resolve disputes before they become formal chargebacks, preventing the fees, ratio damage, and operational costs that inflate your effective processing rate.
Reactive chargeback management (responding to disputes after they’re filed) is expensive and has low win rates. Proactive defense intercepts disputes during the pre-chargeback phase, when card networks send alerts before the dispute formally processes. This window gives you the chance to issue a refund or provide evidence that resolves the issue without a chargeback ever hitting your account.
Specialized dispute management can reduce the overall number of disputed transactions by almost 30% within three months. That’s not just recovered revenue; it’s 30% fewer dispute fees, 30% less staff time on responses, and a cleaner chargeback ratio that keeps you out of monitoring programs.
This is where your choice of merchant services provider matters significantly. BAMS offers proactive chargeback defense with their Dispute Assistant Manager, which intercepts disputes in the alert phase and provides dedicated account management to help you understand why disputes are happening and how to prevent them. Having a partner that treats chargeback defense as a cost optimization tool rather than an afterthought changes the economics.
Anti-patterns: Don’t treat all chargebacks the same. Friendly fraud (customer received the product but disputes anyway) requires different prevention than true fraud. Don’t set fraud filters so aggressively that you decline legitimate orders; the revenue lost to false declines often exceeds chargeback losses. Don’t ignore pre-chargeback alerts, as the response window is typically 24 to 72 hours.
Success indicators: Your chargeback ratio drops below 0.65% (Visa’s standard threshold) and trends toward 0.3% or lower. Dispute fees as a percentage of total processing costs decrease month over month. You receive and respond to pre-chargeback alerts within 24 hours.
Step 4: Use Dispute Data to Refine Fraud Rules
Objective: Turn your chargeback history into an intelligence asset that prevents future disputes and reduces false declines simultaneously.
Every chargeback contains data: the reason code, the transaction amount, the product category, the customer’s device and location, and the payment method used. Most eCommerce teams file this information away after resolving the dispute and never look at it again. That’s a waste.
Export your last six months of dispute data and categorize it. What percentage are friendly fraud versus true fraud versus merchant error (wrong item shipped, subscription not canceled)? Which product categories generate the most disputes? Which traffic sources or marketing channels correlate with higher dispute rates? What’s the average order value of disputed transactions compared to your overall average?
Use these patterns to adjust your fraud rules. If most disputes come from orders over $150 placed with new accounts using expedited shipping, add a verification step for that specific combination rather than tightening rules across all orders. If a specific product category generates disproportionate disputes, investigate whether the product description or imagery is creating mismatched expectations.
Anti-patterns: Don’t build fraud rules based on gut feeling. Use your actual dispute data. Don’t create rules that are so broad they catch legitimate customers. Every false decline is a lost sale and a damaged customer relationship. Don’t set and forget; review fraud rules monthly as patterns change.
Success indicators: Your fraud rule adjustments reduce chargebacks without increasing false decline rates. You can identify the top three dispute drivers by category and have specific mitigation strategies for each. Dispute rates on mobile wallet transactions are measurably lower than on manual card entry.
Step 5: Connect Chargeback Reduction to Cash Flow Timing
Objective: Ensure that the revenue you protect through fewer chargebacks actually reaches your bank account faster, compounding the financial benefit.
Reducing chargebacks protects revenue, but that protection only matters if the money reaches you quickly. Many processors hold funds for 2 to 5 business days, and merchants with elevated chargeback ratios often face extended holds or rolling reserves that lock up a percentage of their processing volume.
As your chargeback ratio improves, you gain leverage to negotiate better settlement terms. Lower-risk merchants qualify for faster funding, sometimes next-day deposits, which means the cash from today’s sales is available tomorrow rather than next week. On a $3 million annual revenue business, the difference between 2-day and next-day funding represents roughly $8,200 in additional working capital available at any given time.
This connects directly to your effective processing cost. When your funds settle faster, you reduce your reliance on credit lines or short-term borrowing to cover operational expenses. You also gain the ability to take advantage of supplier early-payment discounts, which can offset a significant portion of your processing fees.
Anti-patterns: Don’t assume your current settlement timing is fixed. It’s negotiable, especially as your risk profile improves. Don’t overlook rolling reserves; if your processor is holding 5-10% of your volume in reserve due to chargeback history, reducing disputes is the fastest way to release those funds. Don’t treat payment optimization and chargeback reduction as separate projects.
Success indicators: Your settlement timing improves as your chargeback ratio drops. Any rolling reserves are reduced or eliminated. You can quantify the working capital benefit of faster funding in dollar terms.
Step 6: Renegotiate Processing Terms With Better Data
Objective: Use your improved chargeback metrics and transaction mix data to secure lower processing rates, turning operational improvements into permanent cost reductions.
Most eCommerce businesses sign a processing agreement and never revisit the terms. But your processing rate is based partly on your risk profile at the time you signed. If you’ve reduced your chargeback ratio, increased your mobile wallet transaction share, and improved your interchange qualification, you have a legitimate case for better rates.
Prepare a summary showing your chargeback ratio trend (ideally declining over 3 to 6 months), your transaction mix by payment method (highlighting the growing share of tokenized mobile wallet payments), and your effective processing cost breakdown. Present this to your processor or use it to evaluate alternative providers.
The negotiation points are specific. Lower chargeback ratios justify reduced per-transaction fees. Higher mobile wallet adoption demonstrates lower fraud risk. Consistent volume growth gives you leverage on volume-based pricing tiers. If your current processor won’t adjust, these metrics make you an attractive prospect for competitors.
Anti-patterns: Don’t negotiate based on volume alone. Processors care about risk-adjusted volume, meaning high volume with low disputes is far more valuable than high volume with high disputes. Don’t accept bundled pricing that obscures interchange costs. Interchange-plus pricing gives you transparency to verify you’re getting the rates your transaction quality deserves. Don’t wait until your contract renewal to start the conversation.
Success indicators: Your stated processing rate decreases, or your fee structure shifts to interchange-plus with transparent markup. The gap between your stated rate and effective rate narrows. Your total processing costs as a percentage of revenue decrease quarter over quarter.
Practical Examples: The Math in Action
Scenario: Mid-Size eCommerce Brand, 40,000 Monthly Orders
Consider an online retailer processing 40,000 orders per month at a $55 average order value. Their current chargeback rate is 0.45%, which means roughly 180 disputes per month. At an all-in cost of $4 per chargeback dollar lost (including fees, goods, and labor), each dispute on a $55 order costs approximately $220. That’s $39,600 per month in total chargeback-related losses.
After implementing proactive dispute defense and increasing mobile wallet adoption from 15% to 35% of transactions, their chargeback rate drops to 0.20%. That’s 80 disputes per month instead of 180. The monthly savings from fewer disputes alone: $22,000. Add the interchange improvement on the additional 8,000 mobile wallet transactions (0.15% savings on $55 = $0.08 per transaction), and that’s another $640 per month.
The Compounding Effect
The retailer’s improved chargeback ratio qualifies them for next-day funding (previously on 3-day settlement). They eliminate a 5% rolling reserve that was holding $110,000 of their processing volume. And they renegotiate their processing markup from 0.30% to 0.22% based on their improved risk profile, saving an additional $1,760 per month on their full transaction volume.
Total monthly savings: approximately $24,400. Annual impact: over $290,000. None of these savings required increasing sales volume. They came entirely from optimizing how existing transactions are processed and protected.
Common Mistakes and Pitfalls
The most common mistake is treating chargebacks as a customer service problem rather than a financial operations problem. Dispute resolution belongs in your finance and operations workflow, not just your support queue.
Another frequent error is over-correcting on fraud prevention. Merchants who experience a spike in chargebacks often respond by tightening fraud filters dramatically, which blocks legitimate customers. The hidden costs of aggressive fraud filtering (lost sales, damaged customer lifetime value) can exceed the chargeback costs they’re trying to prevent.
Teams also underestimate the timeline. Chargeback ratio improvements take 60 to 90 days to fully reflect in your metrics because disputes from previous months continue to process. Don’t abandon a strategy after 30 days because the numbers haven’t moved yet.
Merchants should also ensure their payment environment follows recognized security practices. PCI Security Standards Council guidance explains how tokenization helps reduce exposure of sensitive payment credentials throughout the payment lifecycle.
Finally, many businesses optimize chargebacks and processing costs in isolation. The entire point of this framework is that they’re connected. A lower chargeback ratio improves your interchange qualification, your settlement timing, and your negotiating position. Treating them as separate projects leaves money on the table.
What to Do Next
Start with Step 1. Calculate your effective processing cost per transaction, broken out by payment method. This single exercise reveals the gap between what you think you’re paying and what you’re actually paying. Most teams are surprised by the result.
From there, pick the step that addresses your biggest cost driver. If your chargeback rate is above 0.3%, focus on proactive dispute defense first. If your mobile wallet adoption is below 20%, prioritize checkout optimization. If you haven’t reviewed your processing terms in over a year, start building the data package for renegotiation.
This isn’t a one-time project. Revisit your effective cost calculation quarterly. As your transaction mix shifts, your chargeback rate changes, and your volume grows, the optimization opportunities shift too. Use this guide as a reference framework, not a one-time checklist, and let each improvement compound into the next.
Frequently Asked Questions
What fees do merchants actually pay on chargebacks beyond the dispute itself?
The dispute fee ($25 to $100 per chargeback) is just the starting point. You also lose the product and shipping cost, the original processing fee (which isn’t refunded), and the labor cost of preparing a dispute response. When you add it all up, each $1 in chargeback losses costs $3.75 to $4.61. Merchants with elevated ratios may also face monthly monitoring program fees from card networks, which can run $10,000 to $25,000 per month.
How does accepting Apple Pay or other mobile wallets reduce fraud costs?
Mobile wallets use device-level tokenization, replacing actual card numbers with unique tokens that are useless if intercepted. They also require biometric authentication (fingerprint or face recognition) for each transaction. This eliminates two major fraud vectors: stolen card numbers and unauthorized card use. The result is significantly fewer fraudulent transactions, which directly reduces your chargeback volume and the costs associated with it.
How can merchants optimize processing costs when using mobile wallets?
Mobile wallet transactions often qualify for more favorable interchange tiers because of their strong authentication and tokenized data. To maximize this benefit, ensure your payment processor correctly identifies and routes mobile wallet transactions. Increase mobile wallet adoption by placing wallet payment buttons prominently in your checkout flow. Track interchange qualification rates by payment method monthly to verify you’re capturing the savings.
When should businesses actively promote mobile wallet payments to customers?
Promote mobile wallets when your data shows they reduce chargebacks and improve checkout completion rates compared to manual card entry. Most businesses see the strongest impact when mobile traffic exceeds 50% of total site traffic, when your chargeback rate on card-not-present transactions is above 0.3%, or when cart abandonment on mobile devices is significantly higher than on desktop. These conditions indicate that mobile wallet adoption will deliver measurable cost and conversion benefits.
How does a lower chargeback rate affect my processing agreement terms?
Processors price risk into your rates. A merchant with a 0.45% chargeback ratio represents meaningfully more risk than one at 0.15%. As your ratio improves, you gain leverage to negotiate lower per-transaction markups, faster settlement timing (including next-day funding), and reduced or eliminated rolling reserves. Document your improvement trend over 3 to 6 months before approaching your processor for renegotiation.
How long does it take to see financial results from chargeback reduction efforts?
Expect 60 to 90 days before chargeback ratio improvements fully appear in your metrics, because disputes filed against previous transactions continue processing during that window. Interchange savings from increased mobile wallet adoption show up faster, typically within one billing cycle. Processing rate renegotiations require 3 to 6 months of documented improvement. The full compounding effect (lower disputes plus better interchange plus improved terms) typically materializes within two quarters.
Sources