Payment Processing Fees: Audit Your Statement in 30 Minutes
Last Updated on July 28, 2026 by Dimitri Akhrin
A line-by-line tutorial to uncover hidden fees, calculate your effective rate, and stop margin leakage
Learn exactly how to read every line on your merchant processing statement, calculate your true all-in cost per transaction, and identify hidden fees. This step-by-step audit framework helps eCommerce operators reclaim thousands in annual revenue — no sales call required.
TL;DR
- Calculate your effective rate first – Divide your total fees by total sales volume. This single number reveals your true cost per dollar, regardless of what your processor quotes you. Typical small-business eCommerce rates run 2.5% to 3.5%.
- Categorize every fee into five buckets – Interchange (non-negotiable), processor markup (negotiable), network assessments (pass-through), monthly recurring fees, and incidental/penalty fees. If the totals don’t match your statement’s bottom line, you’ve missed a charge.
- Hunt for five common hidden charges – PCI non-compliance fees, inflated non-qualified surcharges, batch fee overcharges, duplicate gateway fees, and undisclosed rate increases are the most frequent margin killers on eCommerce processing statements.
- Audit your deposit timing and reserves – If your processor takes 3 or more business days to fund deposits or holds a rolling reserve, that locked cash has a real cost. Next-day funding options exist and can transform your cash flow without raising your rate.
- Repeat quarterly and use your summary as leverage – A documented one-page audit summary gives you concrete data to negotiate with your current processor or get accurate quotes from alternatives. Multiply every small monthly fee by 12 to see the annual impact.
What You’ll Achieve: A Complete Payment Processing Statement Audit in Under 30 Minutes
By the end of this tutorial, you will know exactly how to read every line on your merchant processing statement, calculate your effective rate, identify hidden fees, and determine whether your current payment processing fees are competitive or quietly draining your margins. This is the same audit framework that eCommerce operators use to reclaim thousands in annual revenue.
Your success criteria are simple: you’ll have a single-page summary showing your true all-in cost per transaction, a list of every fee you’re paying (and why), and a clear yes-or-no answer on whether your pricing structure is working for or against your business. No sales call required.
As Doug Kantor of the National Association of Convenience Stores has argued, swipe fees rise faster than many merchants’ margins. In a high-cost market like New York City, that fee leakage compounds fast. This audit gives you the numbers to fight back.
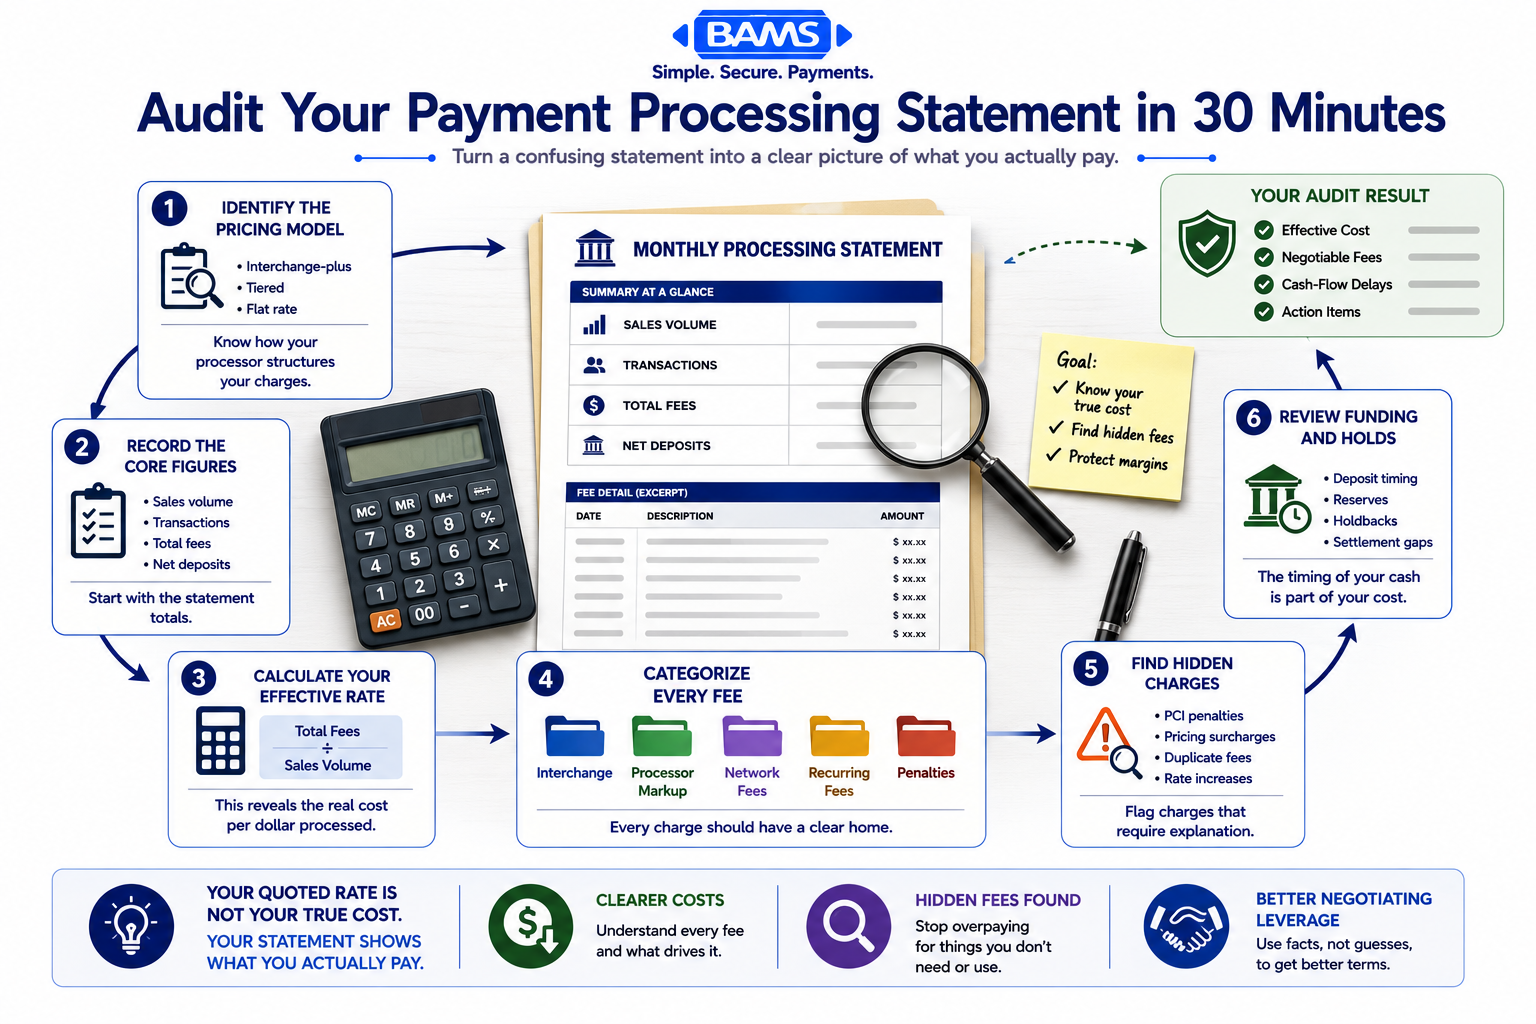
A payment-processing statement becomes easier to audit when every charge is sorted into a clear category and measured against total sales volume.
Prerequisites and Setup: What You Need Before You Start
Gather these items before you begin. Missing even one will slow you down or produce incomplete results.
- Your most recent monthly processing statement (PDF or paper). If you don’t have it, log into your processor’s merchant portal or call their support line to request it.
- One previous month’s statement for comparison (ideally a high-volume month).
- A spreadsheet (Google Sheets, Excel, or even a blank notebook). You’ll record six key numbers.
- A calculator.
- Your current processing agreement or contract summary, if accessible. This helps verify whether the rates on your statement match what you signed.
- 30 uninterrupted minutes.
Time estimate: 25 to 35 minutes for your first audit. Subsequent audits take 10 to 15 minutes once you know where to look.
Potential blocker: Some processors bundle fees into a single line labeled “discount rate” or “processing charges.” If your statement has fewer than five line items, your processor may be using bundled (or “flat rate”) pricing, which makes granular auditing harder. This tutorial covers that scenario in Step 4.
Why a Line-by-Line Audit Matters for NYC eCommerce Operators
Most guides on merchant services tell you to “compare rates” or “negotiate with your processor.” That advice is useless if you don’t know what you’re actually paying. Your processing statement is the only document that tells the truth, and most merchants never read it.
The approach here is methodical: you’ll identify your pricing model, calculate your effective rate, isolate every fee category, and benchmark your costs against industry data. This works whether you’re on interchange-plus pricing, tiered pricing, or flat-rate pricing.
We skip the enterprise-level tactics (payment orchestration layers, multi-acquirer routing) because they don’t apply to teams of 10 to 50 people running established eCommerce operations. What does apply is knowing your numbers cold, so you can make informed decisions about cash flow management, batch submission timing, and whether your processor is actually earning its cut.
Step 1: Identify Your Pricing Model
Open your statement and look for the section labeled “Fees,” “Rate Summary,” or “Transaction Detail.” You need to determine which of three pricing models your processor uses.
Interchange-plus: You’ll see references to “interchange” plus a fixed markup (e.g., “IC + 0.30% + $0.10”). This is the most transparent pricing model. Each card type has a different interchange cost, and your processor adds a consistent margin on top.
Tiered: You’ll see categories like “Qualified,” “Mid-Qualified,” and “Non-Qualified,” each with a different percentage. This model obscures true costs because your processor decides which transactions land in which tier.
Flat rate: You’ll see a single percentage (e.g., 2.9% + $0.30) applied to all transactions. Simple, but often expensive at higher volumes.
Write down your pricing model in your spreadsheet. If you can’t tell, look for the word “interchange” anywhere on the statement. Its presence almost always means interchange-plus. Its absence usually means tiered or flat rate.
Common failure: Some processors use “enhanced interchange-plus” or “subscription” models. If you see a monthly “membership” or “platform” fee alongside interchange references, note that too. It affects your effective rate calculation in Step 3.
Step 2: Record Your Four Core Numbers
Find and record these four figures from your statement. They are usually on the first or summary page.
- Total sales volume (the dollar amount of all transactions processed that month). Label this Volume.
- Total number of transactions. Label this Transactions.
- Total fees charged (the sum of everything your processor deducted). Label this Total Fees.
- Total deposits received (the net amount deposited into your bank account). Label this Net Deposits.
Checkpoint: Volume minus Total Fees should roughly equal Net Deposits. If the gap is larger than expected, your processor may be holding reserves or deducting fees on a different schedule. Flag this for Step 6.
Common failure: Some statements separate credit card and debit card volumes. Add them together for your total unless you want to audit each card type separately (recommended if debit represents more than 30% of your volume).
Step 3: Calculate Your Effective Rate
This is the single most important number in your audit. Your effective rate tells you what you actually pay per dollar processed, regardless of pricing model.
Formula: Effective Rate = (Total Fees ÷ Total Sales Volume) × 100
Example: If your total fees were $3,400 and your sales volume was $140,000, your effective rate is 2.43%.
Now benchmark that number. Visa explains how interchange reimbursement fees are structured within the payment ecosystem, but typical small-business all-in costs run 2.5% to 3.5% per transaction once you include per-transaction fees, monthly fees, and incidentals.
Interpret your result:
- Below 2.5%: You’re in a competitive range. Continue the audit to check for unnecessary line-item fees, but your rate structure is likely sound.
- 2.5% to 3.0%: Common for eCommerce, but there’s room to improve, especially if your average ticket is above $50.
- Above 3.0%: You’re likely overpaying. The remaining steps will help you find where.
- Above 3.5%: Something is wrong. Proceed carefully through Steps 4 through 7.
Write your effective rate in your spreadsheet. Do the same calculation for your comparison month. If the rate jumped more than 0.2% between months without a change in card mix, that’s a red flag.
Step 4: Break Down Every Fee Category
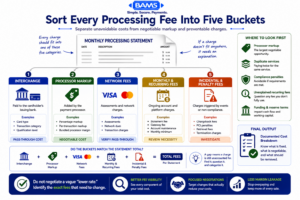
Every processing charge should fit into one of five categories. Separating negotiable processor costs from pass-through and penalty fees makes overpayment easier to identify.
Now go line by line through the fee detail section of your statement. Group each charge into one of these five categories and total each group.
Category 1: Interchange Fees
These are set by card networks (Visa, Mastercard, etc.) and passed through to you. On interchange-plus statements, you’ll see dozens of line items with names like “VS CPS E-COMMERCE” or “MC MERIT III.” You cannot negotiate these, but you can influence which interchange tiers your transactions qualify for through payment optimization strategies like submitting Level II data or settling batches on time.
Category 2: Processor Markup
This is what your processor charges on top of interchange. On interchange-plus, it’s the “plus” part (e.g., 0.25% + $0.10). On tiered pricing, it’s baked into the qualified/non-qualified rates, making it harder to isolate. This is the only category you can directly negotiate.
Category 3: Card Network Fees (Assessments and Dues)
Visa and Mastercard charge small assessment fees (typically 0.13% to 0.15%) plus per-transaction fees. These are non-negotiable but should be passed through at cost. If your statement shows “network fees” as a round number or a suspiciously high percentage, your processor may be padding this line.
Category 4: Monthly and Recurring Fees
Look for charges labeled: statement fee, PCI compliance fee, PCI non-compliance fee, gateway fee, batch fee, monthly minimum, account maintenance fee, or regulatory fee. List each one with its dollar amount.
Category 5: Incidental and Penalty Fees
These include chargeback fees (typically $15 to $25 each), retrieval request fees, early termination fees, and annual fees. Chargebacks deserve special attention because each one costs you the fee plus the lost revenue plus the product cost.
Checkpoint: The sum of all five categories should equal (or come very close to) your Total Fees from Step 2. If there’s a gap, you’ve missed a line item. Go back and find it.
Step 5: Spot the Five Most Common Hidden Charges
With your fees categorized, scan for these specific problems. They account for the majority of overpayment in eCommerce processing statements.
1. PCI Non-Compliance Fee
If you see a monthly charge of $19.95 to $39.95 labeled “PCI non-compliance,” you’re being penalized for not completing your annual PCI Self-Assessment Questionnaire. Fix this by completing the SAQ through your processor’s portal. The fee disappears immediately.
2. Inflated “Non-Qualified” Surcharges
On tiered pricing, processors can route a large percentage of transactions to the “non-qualified” tier, which carries the highest rate (often 3.5%+). If more than 20% of your transactions are classified as non-qualified, your pricing model is working against you. This is the strongest argument for switching to interchange-plus pricing.
3. Batch Fee Overcharges
A batch fee of $0.10 to $0.25 per batch settlement is standard. If you’re seeing $0.50 or more, or if you’re being charged per transaction rather than per batch, flag it.
4. Duplicate Gateway Fees
Some merchants pay a gateway fee to their eCommerce platform (Shopify, WooCommerce) and a second gateway fee to their processor. Check whether you’re being double-charged.
5. Rate Increases Without Notice
Compare your current month’s processor markup to your contract terms and your previous month’s statement. Interchange fees have risen at an average rate of 3.9% per year since 2021, but your processor’s markup should remain stable unless they’ve notified you of a change.
Write down every problematic fee you find. Include the line item name, the amount, and which category it falls into.
Step 6: Check Your Deposit Timing and Holdbacks
This step addresses a core NYC payment challenge that most audit guides ignore: the gap between when you process a sale and when you can actually use the money.
Look at your statement’s deposit schedule or log into your processor’s portal to view deposit dates. Calculate the average number of business days between transaction authorization and bank deposit.
- Same-day or next-day funding: Optimal. Your cash flow model can treat sales as near-immediate revenue.
- 2-day funding: Standard for many processors. Acceptable, but it means weekend sales don’t hit your account until Tuesday or Wednesday.
- 3 to 5-day funding: This delay costs you real money, especially if you’re buying inventory, running ads, or covering payroll on tight cycles. As covered in detail in this guide on why your cash flow model may be wrong, deposit timing is the most undervalued variable in eCommerce cash flow forecasting.
Also check for reserve holds. Some processors hold a percentage of your volume (5% to 10%) in a rolling reserve, especially if you’ve had chargebacks. This money is yours but unavailable for 90 to 180 days. If you see a line item for “reserve” or “holdback,” note the percentage and the release schedule.
Providers like BAMS offer next-day funding as a standard feature for qualifying merchants, which can meaningfully speed up payment deposits without raising costs. If your current processor takes three or more days, this single change can free up working capital you didn’t know was locked.
Step 7: Assess Your Chargeback Exposure
Count the number of chargebacks on your statement and calculate your chargeback ratio:
Chargeback Ratio = (Number of Chargebacks ÷ Total Transactions) × 100
Card networks flag merchants at 0.9% to 1.0%. If you’re above 0.65%, you’re in the warning zone. Each chargeback typically costs $20 to $100 in fees alone, plus the full transaction amount, plus the cost of goods.
For NYC eCommerce operators processing high volumes of card-not-present transactions, chargebacks are a persistent threat to margins. Proactive chargeback prevention through your merchant services provider (including alerts that let you refund before a dispute becomes a chargeback) can reduce this line item significantly.
Record your chargeback count, ratio, and total chargeback-related fees.
Step 8: Build Your One-Page Audit Summary
You now have all the data. Compile it into a single summary in your spreadsheet with these rows:
- Pricing Model: (interchange-plus, tiered, or flat rate)
- Total Volume: $____
- Total Transactions: ____
- Total Fees: $____
- Effective Rate: ____%
- Interchange + Network Fees: $____ (the non-negotiable portion)
- Processor Markup: $____ (the negotiable portion)
- Monthly/Recurring Fees: $____
- Incidental/Penalty Fees: $____
- Problematic Fees Identified: (list each with amount)
- Average Deposit Timing: ___ business days
- Reserve Hold: ___% or $____
- Chargeback Ratio: ____%
- Chargeback Fees: $____
Checkpoint: If your effective rate is above 3.0%, or you found two or more problematic fees, or your deposit timing exceeds two business days, you have concrete, documented reasons to renegotiate or switch processors. This summary is your leverage.
Configuration and Customization: Adjusting the Audit for Your Business
This audit framework works for any eCommerce merchant, but you should adjust these variables based on your situation.
Average ticket size matters. If your average order value is under $30, per-transaction fees ($0.10 to $0.30 each) eat a larger share of revenue than the percentage rate. Weight your analysis toward per-transaction costs. If your AOV is above $100, the percentage rate dominates. Focus there.
Card mix changes your benchmark. If more than 40% of your transactions are from rewards or corporate cards, your interchange costs will be higher than average. An effective rate of 2.8% might be competitive for your mix even though it looks high against the 2.24% national average.
Seasonal businesses should audit peak and off-peak months. Monthly fixed fees (statement fees, PCI fees, gateway fees) hit harder in low-volume months. Calculate your effective rate for both your highest and lowest months to see the true range.
Multi-currency sellers should check for currency conversion markups, which are often 1% to 3% on top of standard processing fees and may appear as a separate line item or be buried in the exchange rate.
Verification and Testing: Confirm Your Audit Is Accurate
Before acting on your findings, verify them with these three checks.
Check 1: Reconcile with your bank. Compare the “Net Deposits” figure on your statement to the actual deposits in your business bank account for the same period. They should match within a few dollars. Discrepancies may indicate fees deducted separately or reserve holds not reflected on the statement.
Check 2: Cross-reference with your eCommerce platform. Your Shopify, WooCommerce, or BigCommerce dashboard shows total sales for the period. This should match (or come very close to) the “Total Volume” on your processing statement. If your platform shows $145,000 but your statement shows $138,000, investigate the gap. It could be refunds, voided transactions, or a timing mismatch.
Check 3: Repeat next month. Run the same audit on next month’s statement. Consistent results confirm your methodology. Significant changes (more than 0.15% in effective rate) without an obvious cause (like a shift in card mix) warrant a call to your processor.
Common Errors and Fixes When Auditing Payment Processing Fees
“My effective rate calculation doesn’t match what my processor quotes me.”
Cause: Your processor likely quotes only the markup rate, not the all-in effective rate. They might say “0.25% + $0.10” but that’s only their margin on top of interchange, assessments, and other fees. Fix: Always use your own Total Fees ÷ Total Volume calculation. That’s the real number.
“I can’t find a fee breakdown on my statement.”
Cause: You may be on a flat-rate or simplified billing plan where fees are bundled into a single deduction. Fix: Call your processor and request a detailed statement or an interchange qualification report. You’re entitled to see where your money goes.
“My total fees don’t add up to what was deducted.”
Cause: Some processors deduct fees on a different billing cycle (e.g., fees for January are deducted in early February). Others split deductions between daily net settlement and a month-end fee deduction. Fix: Check whether your processor uses “daily discount” (fees deducted from each batch) or “monthly discount” (fees deducted in a lump sum). Align your audit period accordingly.
“My chargeback ratio seems impossibly low or high.”
Cause: You may be dividing chargebacks by the wrong denominator. Card networks calculate the ratio using the month the original transactions were processed, not the month the chargebacks were filed. Fix: For a quick audit, your statement’s numbers are close enough. For precision, use your processor’s chargeback report, which maps disputes to their original transaction month.
“I found problems but don’t know if they’re worth acting on.”
Cause: Small fees feel insignificant in isolation. Fix: Multiply each monthly fee by 12 to see the annual cost. A $29.95 PCI non-compliance fee is $359.40 per year. A 0.3% effective rate difference on $150,000 monthly volume is $5,400 per year. Now it’s worth acting on.
Next Steps: Turn Your Audit Into Action
You now have a documented, data-backed picture of your processing costs. Here’s what to do with it.
- Negotiate with your current processor. Use your one-page summary to request specific changes: lower markup, removal of junk fees, or faster deposit timing. Having exact numbers makes this conversation productive instead of adversarial.
- Evaluate alternative processors. Share your audit summary (with sensitive data redacted) to get apples-to-apples quotes. Ask every prospective provider to quote their effective rate on your actual volume and card mix, not a hypothetical.
- Schedule recurring audits. Set a calendar reminder to repeat this audit quarterly. Processing fees shift over time, and a quarterly check keeps you ahead of rate creep.
- Optimize your checkout process. Reducing declines and cart abandonment improves your transaction approval rates, which in turn lowers your cost per successful transaction. That’s a topic worth exploring once your statement is clean.
Frequently Asked Questions
What are the common payment challenges faced by NYC merchants?
NYC eCommerce operators deal with high operating costs that amplify the impact of processing fees. U.S. merchants paid hundreds of billions of dollars in card swipe fees in 2024, and those costs hit harder when you’re also covering New York rents, payroll, and logistics. Delayed deposits (3 to 5 business days with some processors) create cash flow gaps that force merchants to rely on credit lines. High chargeback rates from card-not-present transactions add another layer of cost and risk.
When should merchants conduct a payment processing audit?
At minimum, audit your processing statement quarterly. You should also run an audit immediately after any of these events: your processor notifies you of a rate change, your monthly volume increases or decreases by more than 20%, you notice your effective rate climbing without explanation, or you receive a chargeback notification from a card network. The first audit takes about 30 minutes. Follow-up audits take 10 to 15 minutes once you know the layout of your statement.
What is an effective rate, and why does it matter more than the quoted rate?
Your effective rate is your total processing fees divided by your total sales volume, expressed as a percentage. It captures every cost: interchange, processor markup, network assessments, monthly fees, chargeback fees, and incidentals. Processors often quote only their markup (e.g., “0.25% + $0.10”), which excludes interchange and other pass-through costs. Your effective rate is the only number that tells you what you actually pay per dollar of revenue.
Which factors affect the speed of payment deposits for NYC businesses?
Deposit speed depends on your processor’s funding schedule, your batch submission timing, your chargeback history, and whether your account has a rolling reserve. Processors that offer next-day funding deposit your batch proceeds the following business day. Those on standard 2 to 3 day schedules hold funds longer, and weekend transactions may not arrive until midweek. High chargeback ratios or new accounts may trigger reserve holds that delay access to 5% to 10% of your volume for 90 to 180 days.
How do I know if I’m on the right pricing model?
Interchange-plus pricing is generally the most transparent and cost-effective model for established eCommerce businesses processing more than $10,000 per month. If you’re on tiered pricing and more than 20% of your transactions are classified as “non-qualified,” you’re almost certainly overpaying. Flat-rate pricing (like 2.9% + $0.30) is simple but becomes expensive as volume grows. Run the effective rate calculation from this tutorial on your current statement, then compare it to interchange-plus quotes based on your actual card mix.
Why is payment optimization important for eCommerce in New York City?
NYC eCommerce businesses operate with thinner margins than many national competitors due to higher overhead costs. Credit and debit card swipe fees totaled $236.4 billion in 2024, and that burden falls disproportionately on small and midsize merchants who lack the volume leverage of enterprise retailers. Optimizing your payment processing (through statement audits, better pricing models, faster deposits, and chargeback prevention) directly improves your net margin and frees up cash for inventory, marketing, and growth.