Cash Flow Acceleration Strategies: A 5-Step Forecast
Build a daily cash flow forecast tuned to your actual deposit speed — not generic net-30 templates
Learn to build a daily cash flow forecast that reflects how fast your payment deposits actually land. This step-by-step tutorial helps you spot liquidity gaps, time purchases confidently, and act on real numbers every morning.
TL;DR
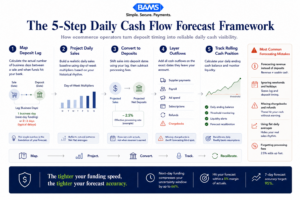
- Map your deposit lag first — Calculate the actual number of business days between a sale and when the funds hit your bank. This single number is the foundation of your entire forecast.
- Project daily sales with day-of-week multipliers — Flat averages miss the natural rhythm of your business. Weight each day based on historical patterns for a more accurate baseline.
- Shift sales into deposit dates, then subtract fees — Your forecast should show when cash arrives, not when it is earned. Apply your deposit lag and effective processing rate to every projection.
- Layer outflows on exact dates — Include supplier payments, payroll, ad spend, refunds, and chargebacks on the days they actually leave your account. Missing chargebacks is the most common forecasting blind spot.
- Faster funding equals a tighter forecast — Next-day deposits compress your uncertainty window and make daily projections significantly more reliable. If your current processor delays funds 2 to 3 days, that gap compounds across your entire forecast.
What You’ll Build: A Daily Cash Flow Forecast Tuned to Your Deposit Speed
By the end of this tutorial, you will have a working daily cash flow forecast that reflects how quickly your payment deposits actually land. Unlike generic forecasting templates built for net-30 invoicing cycles, this one is designed for eCommerce businesses that receive daily deposits, giving you real cash flow acceleration strategies you can act on every morning.
Your finished forecast will show you, day by day, exactly how much cash you expect to have on hand. You will be able to spot liquidity gaps before they happen, time inventory purchases with confidence, and stop guessing whether you can cover Friday’s supplier payment with Thursday’s sales.
Success criteria: You can open your forecast on any given day and verify that your projected available balance matches your actual bank balance within a 5% margin.

The accuracy of a cash flow forecast depends on when deposits actually arrive, not when sales happen.
Prerequisites and Setup
Before you start, gather the following. This tutorial takes roughly 90 minutes for the initial build, then 10 minutes per day to maintain.
- Spreadsheet tool — Google Sheets (free) or Microsoft Excel. The examples below use Google Sheets.
- 30 days of deposit history — Export this from your payment processor dashboard. You need the deposit date, deposit amount, and the corresponding sales date.
- 30 days of outflow records — Pull from your bank account or accounting software (QuickBooks, Xero, etc.). Include supplier payments, payroll, ad spend, subscriptions, and refunds.
- Your processor’s funding timeline — Know whether your deposits arrive same-day, next-day, or on a 2 to 3 day delay. This single variable changes everything.
- Access to your chargeback and refund logs — These are cash outflows that many forecasts miss.
Potential blocker: If your processor batches deposits weekly or holds reserves, your deposit history may not map cleanly to daily sales. You will address this in Step 2.
Why This Approach Works for Daily-Deposit eCommerce
Most cash flow forecasting guides assume you send invoices and wait weeks to get paid. That model is irrelevant for eCommerce operators processing card transactions daily. Your challenge is different: you already get paid quickly, but Modern Treasury payment operations resources continue to emphasize that limited visibility into receivables, settlement timing, and operational cash positioning creates major forecasting accuracy issues for growing businesses.
The approach here treats your payment processor’s deposit schedule as the heartbeat of your forecast. Instead of projecting monthly revenue and dividing by 30, you will model actual daily deposit patterns, account for processing fees and chargebacks at the transaction level, and layer outflows on top. The result is a forecast granular enough to improve liquidity decisions you make every single day.
This method works whether you receive funds next-day or on a 3-day delay. Faster funding simply tightens the forecast and makes it more accurate.
Step 1: Map Your Actual Deposit Lag
Open your 30-day deposit history export. For each deposit, note two dates: the date customers made their purchases and the date the funds appeared in your bank account. Calculate the difference in days for every deposit.
Create a simple table in your spreadsheet with these columns: Sales Date, Deposit Date, Lag (Days), Gross Amount, Net Amount (After Fees). Fill in all 30 days.
Expected result: You should see a consistent pattern. If your processor offers next-day funding, most lags will show as 1 business day. If you see lags of 2 to 3 days, that is your current baseline.
Common failure: Weekend and holiday deposits often skew the numbers. If a Friday sale shows a Monday deposit, that is technically 1 business day, not 3 calendar days. Use business days for your lag calculation to keep things accurate.
Checkpoint: Calculate your average deposit lag. Write this number down. You will use it in Step 3.
A reliable forecast is built by mapping deposits, timing outflows, and recalibrating against real cash movement daily.
Step 2: Build Your Daily Sales Projection
In a new sheet, create a row for each day of the upcoming 30-day period. You need a realistic daily sales estimate, not a hope-based number.
Use this formula for your baseline projection: Take your trailing 30-day average daily gross sales. Then apply a day-of-week multiplier. Most eCommerce businesses see predictable patterns (higher sales on certain weekdays, dips on others).
Day-of-Week Multiplier = (Average sales on that weekday) / (Overall daily average)
Projected Sales for Tuesday = Overall Daily Average × Tuesday Multiplier
If you are running a known promotion or entering a seasonal peak, adjust the relevant days upward. Be conservative. Overestimating sales is the fastest way to create a dangerous forecast.
Expected result: A column of projected daily gross sales figures that reflect your actual weekly rhythm.
Common failure: Using a flat daily average ignores that your Monday sales might be 40% higher than your Sunday sales. The day-of-week multiplier corrects this.
Step 3: Convert Sales Projections into Deposit Projections
This is where your deposit lag from Step 1 transforms the forecast. For each projected sales day, shift the expected deposit forward by your average lag. Then subtract your average processing fee percentage to get the net deposit amount.
Projected Net Deposit = Projected Gross Sales × (1 – Processing Fee Rate)
Deposit Arrival Date = Sales Date + Deposit Lag (in business days)
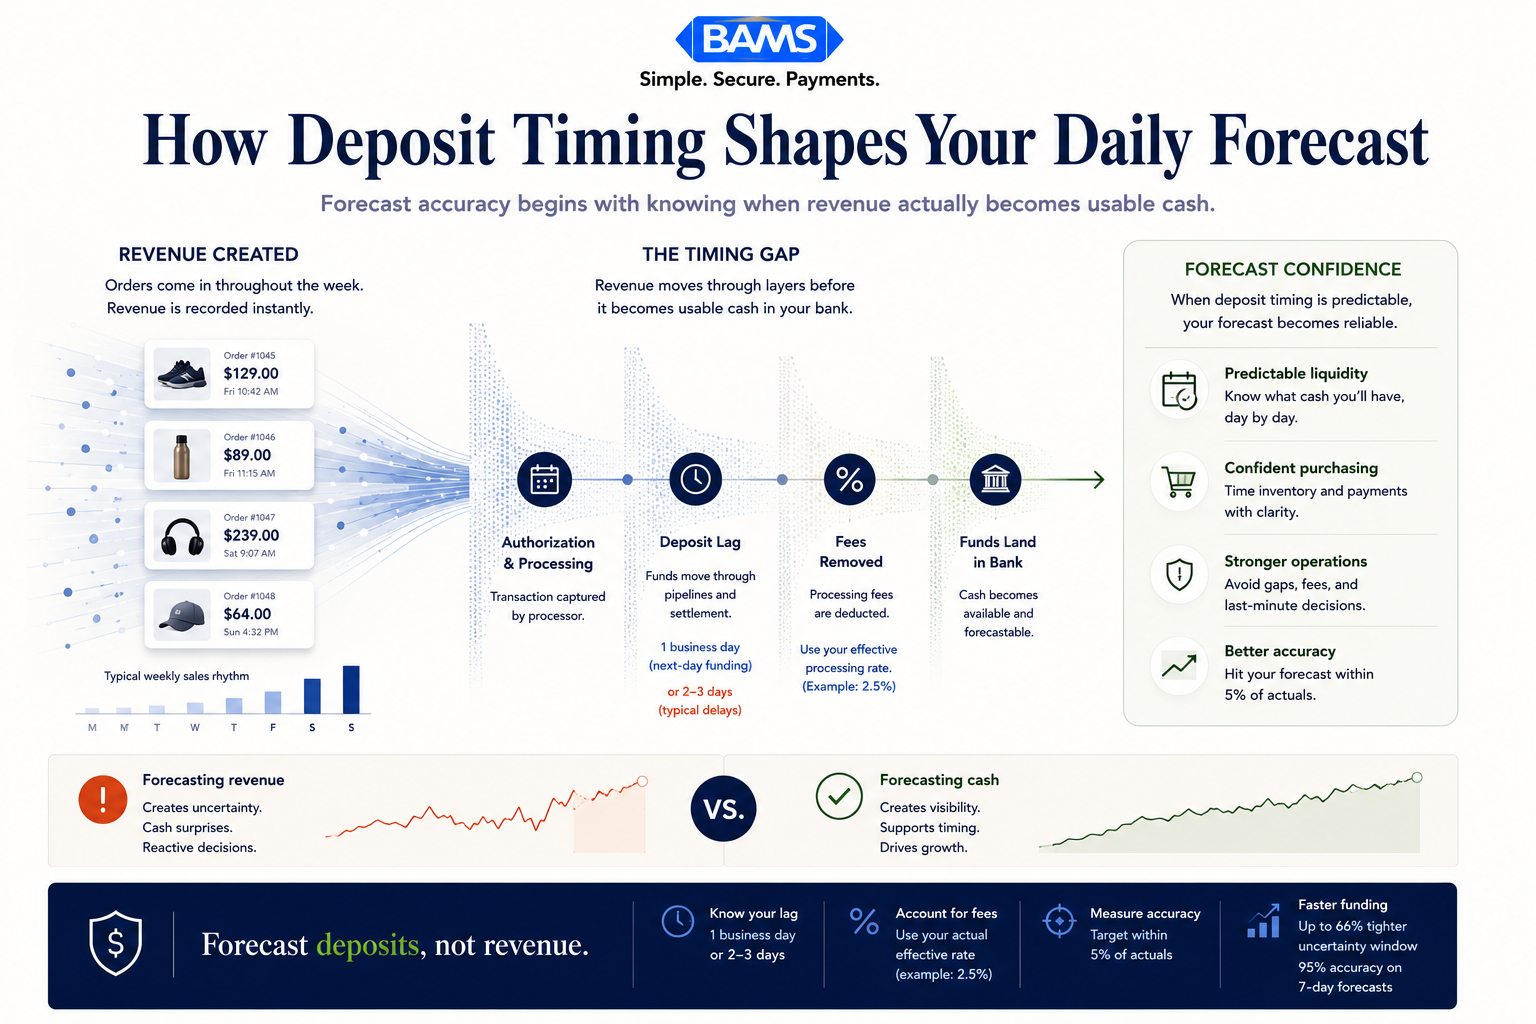
For example, if your average lag is 1 business day and your effective processing rate is 2.5%, a projected $10,000 Monday sale becomes a $9,750 deposit landing on Tuesday.
This is the step where funding speed becomes a strategic lever. A business receiving next-day deposits can forecast with near-certainty what lands tomorrow. A business waiting 3 days is always guessing across a wider window. If you are currently on a 2 to 3 day delay, consider whether switching to next-day funding could tighten your forecast and free up working capital.
Checkpoint: Your spreadsheet should now have a column showing the expected net deposit amount for each calendar day, based on when sales actually convert to cash in your account.
Step 4: Layer in Your Daily Outflows
Now build the other side of the equation. In your forecast sheet, add columns for every category of cash leaving your account. At minimum, include these:
- Supplier and inventory payments — Enter on the date each payment is due or scheduled.
- Payroll — Enter on your actual payroll dates.
- Advertising spend — If you run daily ad budgets, enter the daily charge amount.
- Subscriptions and SaaS tools — Enter on their billing dates.
- Refunds and chargebacks — Use your trailing 30-day average as a daily estimate. Merchant Payments Coalition resources continue to highlight how payment disputes, interchange complexity, and settlement friction create operational forecasting blind spots for merchants.
- Taxes and fees — Sales tax remittances, platform fees, shipping costs.
For variable outflows like ad spend, use your current daily budget as the default. For irregular expenses, place them on the exact date they are scheduled.
Expected result: A total daily outflow figure for each day of your 30-day forecast window.
Common failure: Forgetting that chargebacks deduct from future deposits, not from your bank account directly. Check how your processor handles chargebacks and model accordingly.
Step 5: Calculate Your Rolling Daily Cash Position
Now bring it all together. Add a Starting Balance cell at the top of your forecast. Enter your actual bank balance as of today. Then, for each day, calculate:
End-of-Day Balance = Previous Day’s End Balance + Today’s Net Deposits – Today’s Total Outflows
This gives you a rolling cash position that updates day by day. Any day where the end-of-day balance drops below your minimum comfort threshold (you decide this number) is a red flag.
Set conditional formatting so that any balance below your threshold turns red. This visual alert lets you scan 30 days in seconds and spot trouble before it arrives.
Expected result: A complete 30-day daily cash flow forecast showing your projected available cash for every single day.
Checkpoint: Compare today’s projected balance against your actual bank balance. They should be close. If they diverge by more than 5%, revisit your deposit lag and outflow entries.
Configuration and Customization
Variables You Should Adjust
- Minimum cash threshold — Set this to the amount you need to cover 3 to 5 days of fixed outflows. This is your early warning line.
- Processing fee rate — Use your actual effective rate from last month’s statement, not the quoted rate. Effective rates include interchange markups, assessment fees, and per-transaction charges.
- Chargeback reserve — If your processor holds a rolling reserve, subtract that from your available deposits. This is money you cannot spend.
- Forecast horizon — 30 days is the sweet spot for operational decisions. Extend to 60 or 90 days for inventory planning, but expect accuracy to drop.
Safe Defaults vs. Must-Change Settings
Safe default: Day-of-week multipliers can stay at 1.0 if you are just getting started. You will refine them after two weeks of actual data.
Must change: Your deposit lag and processing fee rate. Using incorrect values here makes the entire forecast unreliable. Pull these from your actual processor reports, not from assumptions.
Verification and Testing
Run your forecast alongside reality for 5 business days before trusting it for decisions. Each morning, record your actual bank balance and compare it to what the forecast predicted.
Success definition: Your forecast’s projected end-of-day balance matches your actual balance within 5% on at least 4 out of 5 days.
Test these edge cases specifically:
- Weekend transitions — Do Monday deposits reflect Friday and Saturday sales correctly?
- High-refund days — Does a spike in returns show up in the right place?
- Holiday weeks — Does the forecast account for bank holidays delaying deposits by an extra day?
If your forecast consistently undershoots or overshoots, adjust your deposit lag or sales multipliers. Small calibrations in the first two weeks pay off with months of reliable data.
Streamline Payment Processing to Improve Forecast Accuracy
The tighter your deposit timing, the more accurate your forecast becomes. Here are the most common errors eCommerce managers encounter, along with fixes.
- Symptom: Forecast shows cash available, but bank balance is lower. Cause: Your processor is holding a reserve or delaying a batch. Fix: Check your processor dashboard for held funds. Add a “reserve hold” row to your outflows. Learn more about why funding can take longer than expected.
- Symptom: Deposits arrive in lumps instead of daily. Cause: Your processor batches settlements every 2 to 3 days. Fix: Group your sales projections into matching batch windows, or switch to a processor that offers daily settlement.
- Symptom: Forecast is accurate on weekdays but wrong on Mondays. Cause: Weekend sales are landing as a single Monday deposit. Fix: Combine Saturday and Sunday projected sales into Monday’s deposit column.
- Symptom: Cash position steadily drifts from forecast over 2 to 3 weeks. Cause: You are not updating the forecast with actual figures. Fix: Each morning, replace yesterday’s projection with the actual deposit and outflow numbers. This keeps the rolling balance anchored to reality.
- Symptom: Chargebacks create surprise shortfalls. Cause: Chargebacks are deducted from deposits days or weeks after the original sale. Fix: Add a daily chargeback estimate based on your trailing average. Proactive chargeback prevention strategies can also reduce the variance.
47% of U.S. small businesses reported being unable to cover a financing need with their own cash reserves in the prior 12 months. A forecast that catches shortfalls 10 to 15 days in advance gives you time to act instead of scramble.
How to Accelerate Cash Inflows and Tighten Your Forecast Further
Once your daily forecast is running, you can start optimizing the inputs. The biggest lever is deposit speed. Moving from a 3-day funding delay to next-day funding compresses your forecast uncertainty window by 66%. BAMS offers next-day funding with a 9 PM EST cutoff, which means sales processed in the evening still land the next business day. For eCommerce managers forecasting daily, that predictability directly translates to tighter cash projections.
Other improvements to consider:
- Automate your outflow tracking. Federal Reserve payment system resources continue to emphasize the importance of operational visibility, liquidity monitoring, and payment infrastructure efficiency for businesses managing daily settlement cycles.
- Add a real-time dashboard layer. NACHA ACH Network resources continue to emphasize how settlement timing, payment visibility, and ACH processing workflows directly affect liquidity planning and forecasting reliability.
- Use the forecast to time inventory purchases. Instead of buying inventory on a fixed schedule, align purchase orders with your projected cash peaks. This is the intersection of funding speed and operational agility that most eCommerce businesses overlook.
Next Steps and Extensions
You now have a working daily cash flow forecast calibrated to your deposit timing. Here is where to go next:
- Build a scenario layer. Duplicate your forecast and model a 20% sales drop or a major supplier payment moving up. This gives you a stress-tested view alongside your base case.
- Integrate with inventory planning. Use your projected cash peaks to identify the best days to place purchase orders, turning your forecast into a buying calendar.
- Review your funding timeline quarterly. As your business grows, your processor relationship and funding options may change. Check whether you qualify for faster settlement or lower rates. Read about how merchant payout timing works to understand what is possible.
A forecast is only as good as the data feeding it. Update it daily, calibrate it weekly, and it becomes the most reliable financial tool in your operation.
Frequently Asked Questions
What is a cash flow acceleration strategy?
A cash flow acceleration strategy is any tactic that gets money into your account faster or reduces the time between earning revenue and having spendable cash. For eCommerce businesses, the most impactful strategy is reducing your deposit lag from your payment processor. Moving from 3-day to next-day funding, for example, means you can reinvest sales revenue a full two days sooner.
How can businesses improve cash flow forecasting with real-time data?
73% of organizations say they need same-day visibility into cash positions for better short-term decisions. You can improve forecasting by connecting your bank feed and processor dashboard to your spreadsheet or accounting tool, then replacing projections with actuals each morning. The faster your deposits arrive, the less you rely on estimates.
Why is optimizing merchant services important for cash flow?
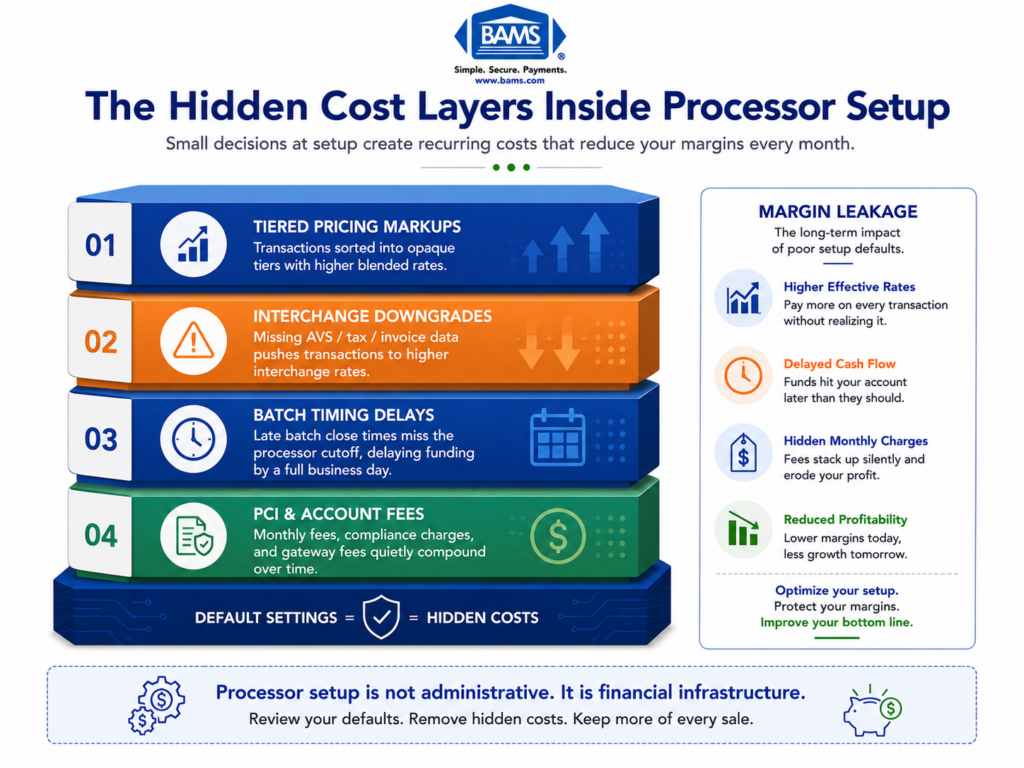
Your merchant services provider controls two critical variables in your cash flow: how fast you get paid and how much you pay in fees. A processor with a 3-day hold and high interchange markups creates a wider gap between your sales and your available cash. Optimizing your processor relationship (faster funding, lower effective rates) directly tightens your daily forecast and increases the cash you can deploy.
How accurate can a daily cash flow forecast be?
With next-day funding and consistent daily updates, most eCommerce businesses can achieve 95% accuracy on a 7-day forward window. Accuracy drops as you extend further out, typically to 85 to 90% at the 30-day mark. The key is replacing projections with actual numbers every day, which keeps your rolling balance anchored to reality.
Which payment solutions can help reduce processing fees?
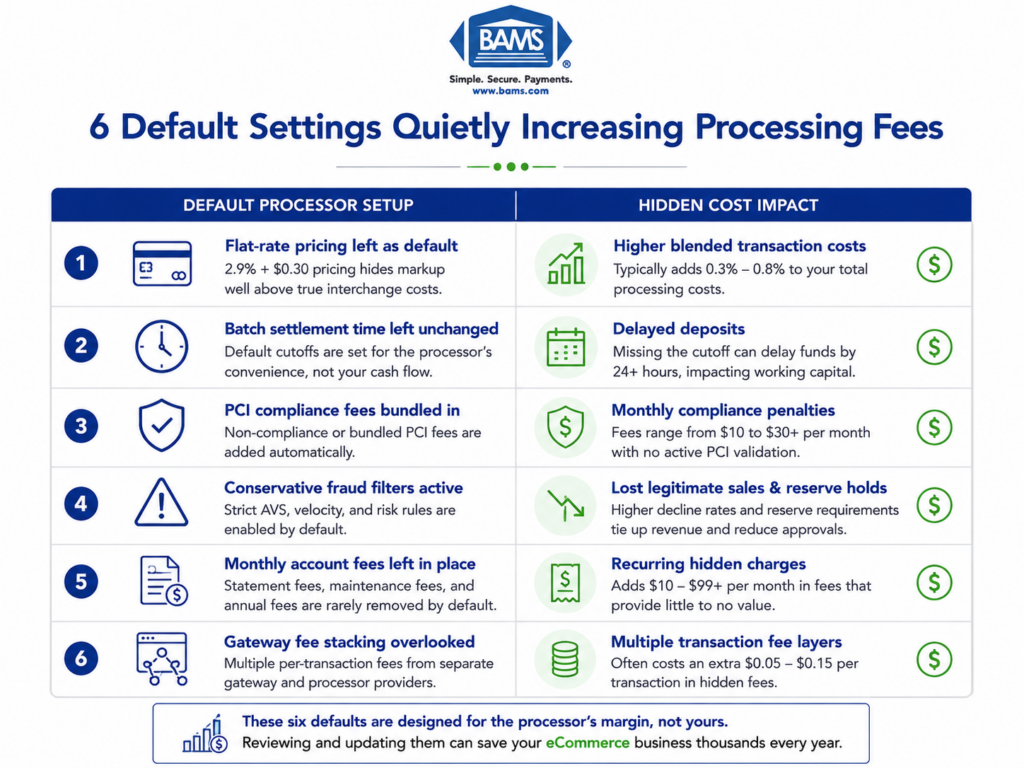
Look for processors that offer interchange-plus pricing (where you see the actual card network cost plus a transparent markup) rather than flat-rate or tiered pricing. Also consider processors that support Level 2 and Level 3 data for B2B transactions, which can qualify for lower interchange rates. Reducing your effective processing rate by even 0.3% improves every single day of your forecast.
How often should I update my daily cash flow forecast?
Update it every business day. Spend 10 minutes each morning replacing yesterday’s projected deposit and outflow figures with the actual numbers from your bank account and processor dashboard. This daily calibration prevents drift and keeps your 30-day forward view reliable. Federal Reserve Small Business Survey data continues to show that liquidity visibility and cash flow predictability remain top priorities for growing businesses.