Payment Processing Costs: What Your Statement Hides
Last Updated on October 6, 2026 by Dimitri Akhrin
How to read beyond the totals and uncover the hidden cost drivers inflating your merchant fees
Learn why your monthly processing statement shows cost outcomes but not cost drivers — and how that gap leads to overpaying. This guide breaks down interchange qualification failures, hidden markups, and the concrete steps to take back control.
TL;DR
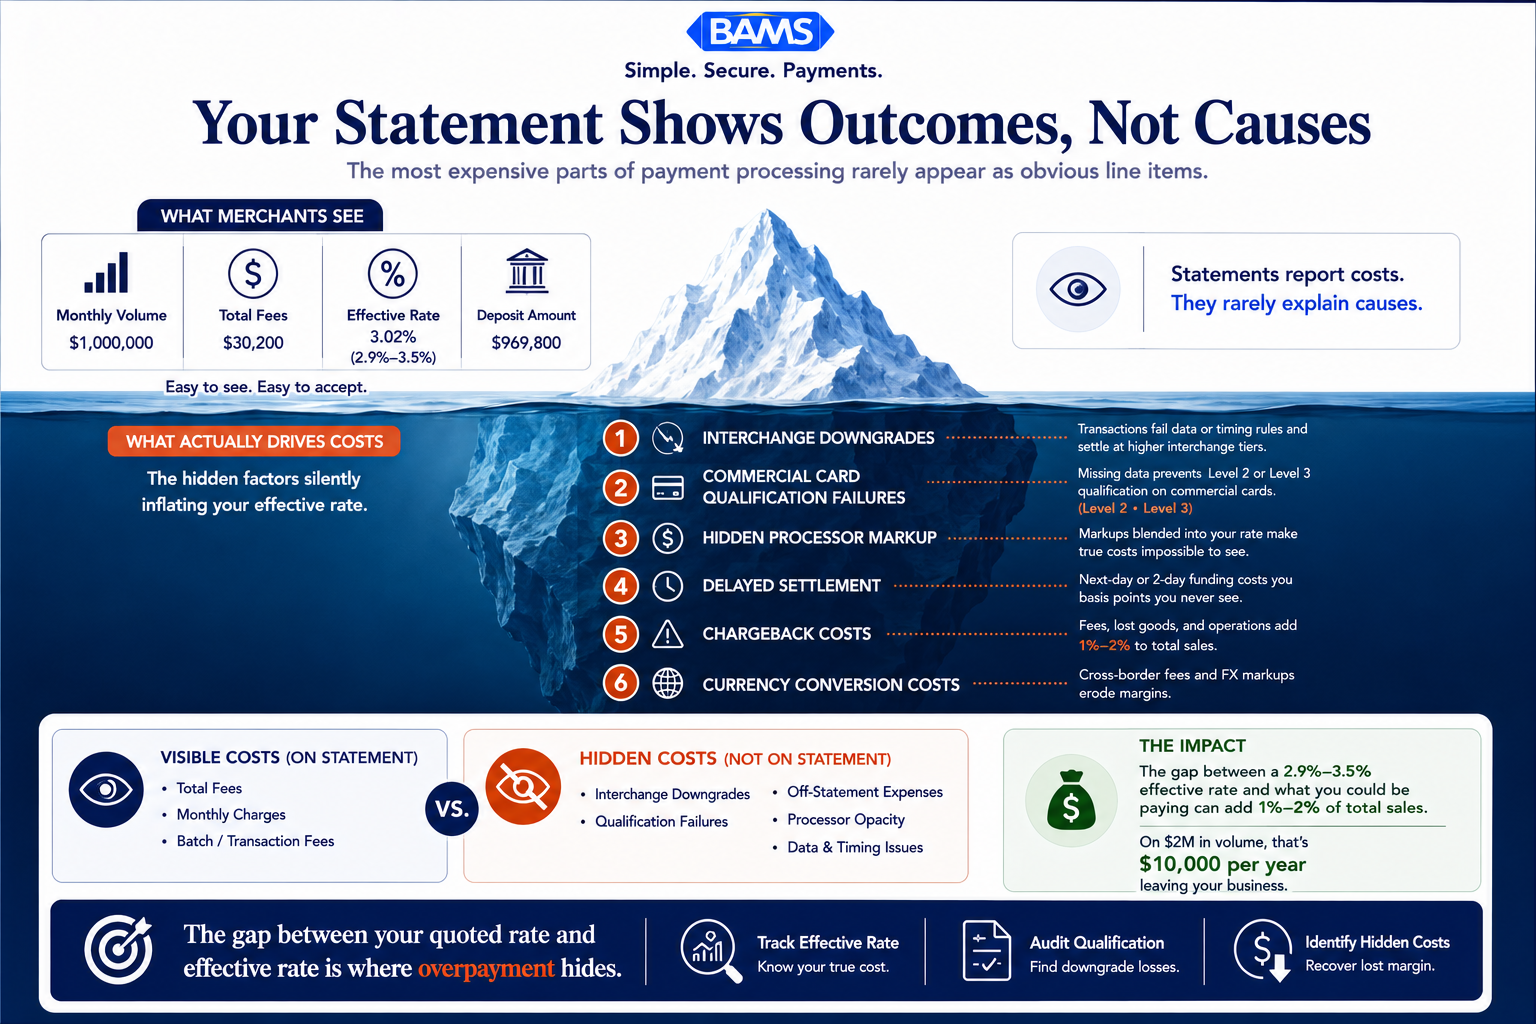
- Your statement shows outcomes, not causes — It tells you what you paid but not why you paid that amount or whether it was avoidable. The gap between your quoted rate and your effective rate is where overpayment hides.
- Interchange downgrades are the biggest invisible cost — When transactions fail to meet data or timing requirements, they settle at higher interchange tiers. This is especially costly on commercial card transactions that could qualify for Level 2 or Level 3 rates but don’t because the right data isn’t being submitted.
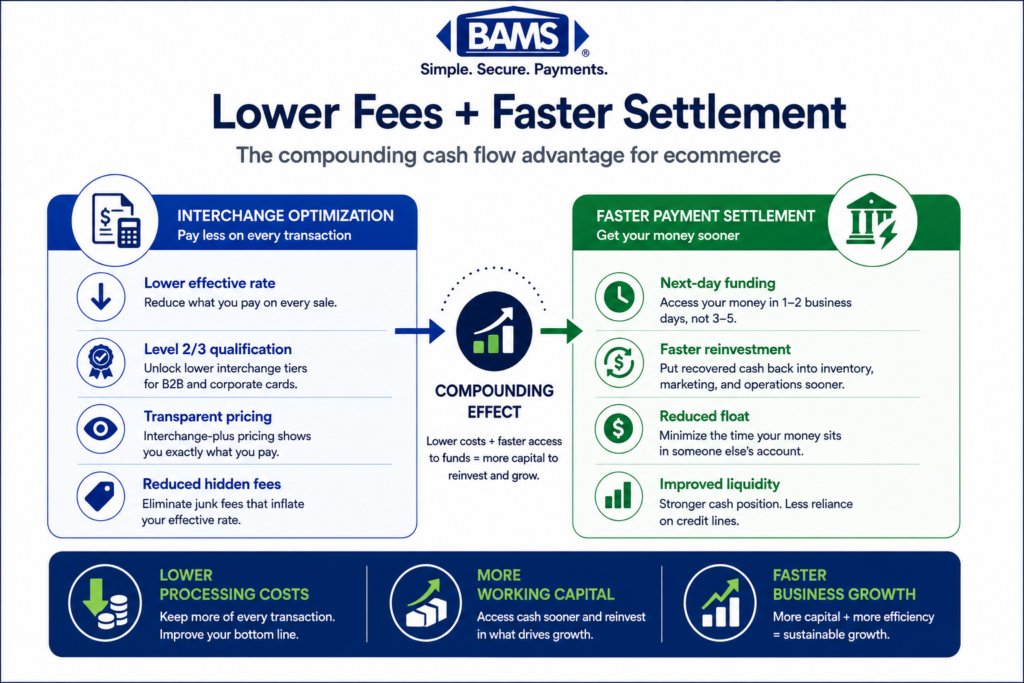
- Off-statement costs matter — Chargebacks, currency conversion, fraud prevention, delayed funding, and compliance fees can add 1% to 2% of total sales and never appear on your processing statement.
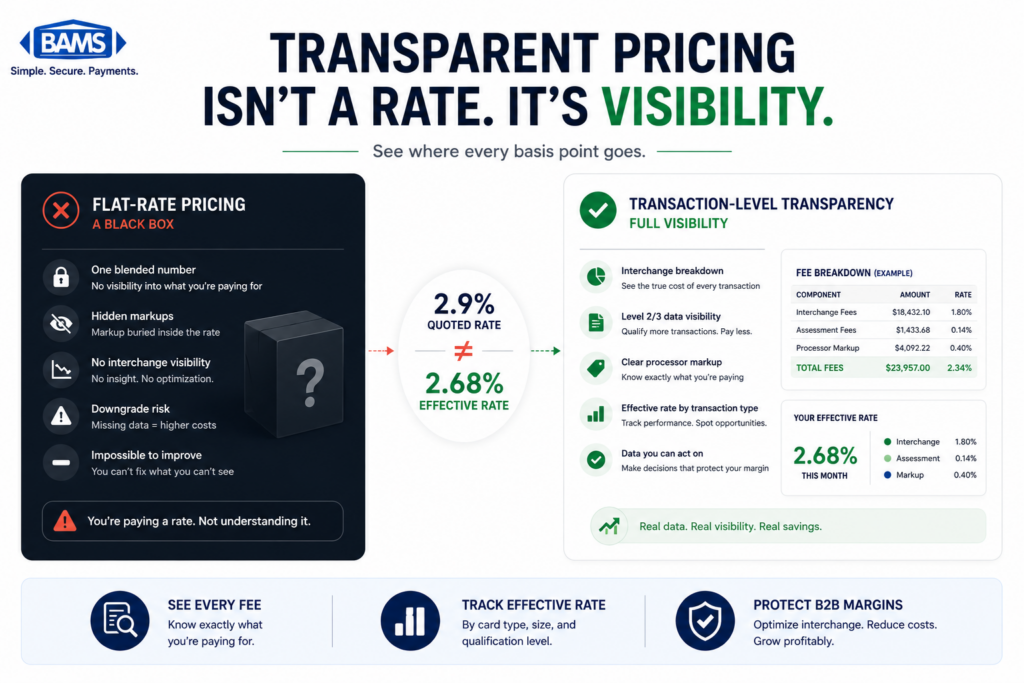
- Your pricing model determines your visibility — Flat-rate pricing bundles interchange, assessments, and markup into one number, making it impossible to identify where you’re overpaying. Interchange-plus pricing separates these layers and gives you the information needed to optimize.
- Start by calculating your effective rate — Divide total fees by total volume for the last three months. If the number is higher than expected or trending upward, you have a specific, quantified reason to investigate further.
Guide Orientation: What This Guide Covers and Who It’s For
Your processing statement arrives every month. It shows totals, rates, and fees. But it doesn’t show you the gap between what you paid and what you should have paid. This guide examines why your payment processing costs are only partially visible on your statement, what’s missing, and how to close that gap.
This is written for eCommerce managers at established online businesses (roughly 10 to 50 employees) who process a meaningful volume of card transactions and suspect they’re overpaying but can’t pinpoint where. If you’ve ever compared your statement to a competitor’s rate sheet and felt confused rather than informed, this is for you.
By the end, you’ll understand exactly which cost components your statement obscures, how interchange qualification failures silently inflate your fees, and what concrete steps you can take to move from passive statement reading to active cost control. This guide does not cover POS hardware selection, gateway migration, or chargeback dispute procedures. It focuses entirely on the economics hiding inside (and outside) your monthly statement.
Why Payment Processing Costs Deserve More Scrutiny Than Your Statement Provides
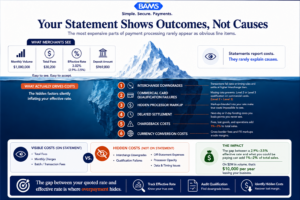
Your statement tells you what you paid. It rarely tells you why you paid it.
The processing statement is the single most common tool merchants use to evaluate their payment costs. It’s also one of the least useful. Not because it contains false information, but because it presents cost outcomes without cost drivers. You see what happened. You don’t see what could have happened differently.
This matters more now than it did five years ago. Federal Reserve interchange fee data continues to demonstrate how card type, transaction qualification, and interchange categories materially affect merchant payment processing costs.
Meanwhile, indirect processing costs like chargebacks, fraud prevention tools, and administrative overhead can add another 1% to 2% of total sales. None of these show up on a standard processing statement. For a business doing $2 million in annual card volume, the difference between a 2.9% effective rate and a 2.4% effective rate is $10,000 per year. That’s not a rounding error. That’s a hire, a marketing campaign, or a margin improvement that compounds every month. Merchant Payments Coalition resources continue to highlight how payment friction, interchange complexity, chargebacks, and operational payment costs create significant financial pressure for merchants.
The cost of inaction isn’t dramatic. It’s slow. It’s the steady leak you normalize because the statement looks “about right” compared to last month. Statement literacy isn’t optional anymore. It’s a prerequisite for cost control.
Core Concepts: What Your Statement Actually Contains (and What It Doesn’t)
The Three Layers of Processing Fees
Every card transaction you process incurs three distinct cost layers: interchange (paid to the card-issuing bank), assessments (paid to the card network like Visa or Mastercard), and processor markup (paid to your payment processor). Flat-rate processors bundle all three into a single advertised rate, which means you can’t see how much of your fee is non-negotiable (interchange) versus negotiable (markup).
This distinction is critical. Interchange is set by card networks and varies by card type, transaction method, and data quality. Assessments are small, fixed percentages. The processor markup is the only component you can directly negotiate or reduce by switching providers. If your statement doesn’t separate these three layers, you’re flying blind.
Effective Rate vs. Quoted Rate
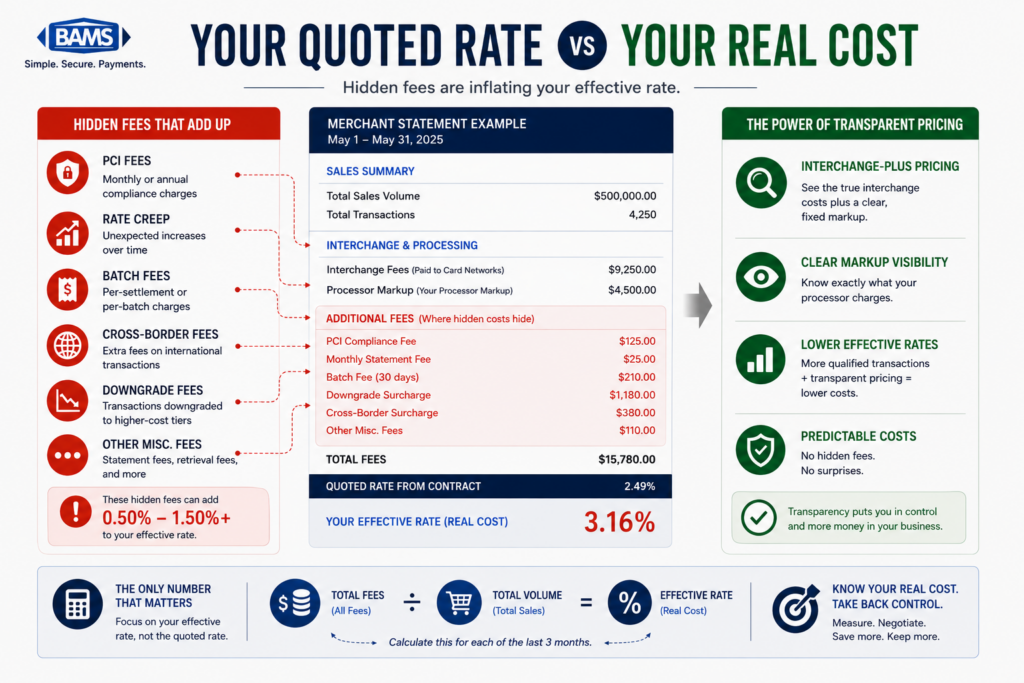
Your quoted rate is the number your processor advertised when you signed up. Your effective rate is what you actually pay: total fees divided by total volume. These two numbers almost never match. The gap between them is where overpayment hides. A quoted rate of 2.6% can easily become an effective rate of 3.2% once downgrades, non-qualified surcharges, and miscellaneous fees are factored in. If you’ve never calculated your effective rate, start there. It’s the single most honest number in your payment economics. For a detailed walkthrough, see this guide on why the advertised rate is often misleading.
Interchange Qualification and Downgrades
Not every transaction qualifies for the lowest interchange rate. When a transaction fails to meet the card network’s data or processing requirements, it gets “downgraded” to a higher rate category. This is the single largest source of invisible overpayment for eCommerce merchants. Your statement may show the downgraded rate as if it were the standard cost. It rarely tells you why the downgrade happened or that it was preventable.
The Framework: From Statement Reading to Cost Control
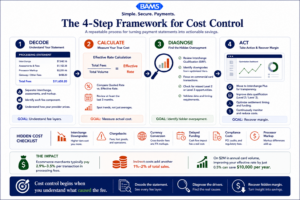
Most merchants stop at reading their statement. Cost control starts when you begin diagnosing what caused the numbers.
Moving from passive statement consumption to active cost management requires a four-phase approach. Each phase builds on the previous one, and skipping phases leads to incomplete conclusions.
- Phase 1: Decode — Understand what each line item on your statement represents and which cost layer it belongs to.
- Phase 2: Calculate — Derive your true effective rate and compare it against your quoted rate and industry benchmarks.
- Phase 3: Diagnose — Identify where downgrades, hidden fees, and data qualification failures are inflating your costs.
- Phase 4: Act — Implement changes to your data practices, pricing model, or processor relationship to close the gap.
These phases are not a one-time project. They form a recurring cycle. Your transaction mix changes, card network rules evolve, and processors adjust their fee schedules. Revisiting this framework quarterly keeps your costs aligned with reality.
Step-by-Step: How to Find What Your Statement Is Hiding
Step 1: Separate the Three Fee Layers on Your Current Statement
Objective: Identify whether your statement exposes interchange, assessments, and markup as separate items, or bundles them together.
Pull your most recent processing statement and look for line items labeled “interchange,” “network fees” or “assessments,” and “discount rate” or “processing fee.” If you see a single percentage applied uniformly across all transactions, you’re on a flat-rate or tiered pricing model. This means the processor’s markup is invisible to you.
If your statement does break out interchange, check whether individual transactions show different interchange categories (e.g., “CPS Retail,” “EIRF,” “Standard”). These category names reveal whether transactions qualified at the best available rate or were downgraded. A statement full of “Standard” or “EIRF” designations is a red flag: those are downgrade categories that carry significantly higher interchange costs.
What to avoid: Don’t assume that seeing multiple line items means you have full transparency. Some processors list interchange as a single averaged number rather than showing per-transaction qualification, which still hides the downgrade problem. Also avoid comparing your flat rate to someone else’s interchange-plus rate without accounting for the structural difference.
How to verify progress: You can clearly state which pricing model you’re on (flat-rate, tiered, or interchange-plus) and whether your statement shows per-transaction interchange categories. If it doesn’t, that’s your first finding: you lack the data to evaluate your own costs. For a line-by-line approach, this hidden fees audit guide walks through each section of a typical statement.
Step 2: Calculate Your True Effective Rate
Objective: Establish the single number that represents your actual cost per dollar processed.
Take your total fees for the month (every fee on the statement, including monthly charges, PCI fees, batch fees, and any other line items) and divide by your total processing volume. Multiply by 100 to get a percentage. This is your effective rate. Credit card processing fees typically range from 1.5% to 3.5% for most businesses, so if your effective rate is above 3.0% for standard eCommerce, you have room to investigate. Federal Reserve Small Business Survey data continues to show that cash flow visibility, cost management, and operational efficiency remain major priorities for growing businesses.
Now compare this to your quoted rate. If your processor quoted you 2.6% + $0.10 per transaction, but your effective rate is 3.3%, that 0.7% gap represents real money. On $150,000 in monthly volume, that’s $1,050 per month in costs above what you expected. Do this calculation for the last three months to see whether the gap is consistent or growing.
What to avoid: Don’t exclude monthly fixed fees or “miscellaneous” charges from your calculation. The effective rate must capture everything you pay. Also don’t compare your effective rate to the interchange-only benchmarks published by Visa and Mastercard. Those exclude assessments and markup entirely, so the comparison will always look unfavorable and won’t tell you anything useful.
How to verify progress: You have a single percentage for each of the last three months, and you can articulate the gap between your effective rate and your quoted rate in both percentage points and dollars.
Step 3: Identify Interchange Downgrades and Their Causes
Objective: Determine how many of your transactions are failing to qualify for the best available interchange rate, and why.
This is where the real money hides. Interchange rates vary dramatically based on factors like card type (consumer vs. commercial), transaction method (card-present vs. card-not-present), and the quality of data submitted with the transaction. For eCommerce, the most common downgrade triggers are: failing to settle transactions within the required window (typically 24 hours), not passing Address Verification Service (AVS) data, and submitting insufficient data on commercial card transactions.
Commercial cards (corporate purchasing cards, business credit cards) are particularly important for eCommerce merchants who sell to other businesses. These cards are eligible for lower interchange rates when you submit Level 2 data (tax amount, customer code) or Level 3 data (line-item detail including product descriptions, quantities, and unit costs). Most eCommerce merchants don’t realize they’re receiving commercial card orders at all, and their gateway submits only Level 1 data by default. The result: every commercial card transaction gets downgraded to the highest interchange tier.
What to avoid: Don’t assume downgrades only affect a small portion of your volume. For B2B eCommerce merchants, commercial cards can represent 15% to 30% of transactions. Even for primarily B2C businesses, corporate cards used by purchasing departments or employees on business accounts trigger the same downgrade penalties. Also avoid the assumption that your processor is automatically optimizing data submission on your behalf. Many don’t, and some charge for Level 2/3 optimization they aren’t actually performing.
How to verify progress: You can identify the percentage of your transactions that settled at downgraded interchange categories, and you have a hypothesis about whether data quality, settlement timing, or card mix is the primary driver.
Step 4: Audit for Fees That Don’t Appear on the Statement
Objective: Account for processing-related costs that your statement never reports.
Your processing statement covers direct transaction fees. It does not cover the full cost of accepting payments. Indirect costs like chargebacks, fraud prevention, and administrative overhead can add 1% to 2% of total sales. Average chargeback fees range from $20 to $100 per incident, and that’s before you count the lost merchandise, the staff time spent responding, and the potential for rate increases if your chargeback ratio climbs.
If you sell internationally, currency conversion fees commonly range from 1% to 3% of the transaction value. These may appear on your statement as a single line item, but they’re often embedded in the exchange rate itself, making them invisible unless you compare the applied rate to the mid-market rate at the time of the transaction.
Other off-statement costs include: PCI compliance fees (and non-compliance penalties), gateway fees charged by your eCommerce platform separately from your processor, and the opportunity cost of delayed funding. If your processor holds funds for 48 to 72 hours, that’s working capital you can’t deploy. Over a year, delayed access to $50,000 in weekly revenue has a real cost to your cash flow and planning.
What to avoid: Don’t treat these as “soft costs” that don’t warrant tracking. They’re real expenses that affect your margin. Also don’t assume your eCommerce platform’s built-in payment processing is automatically cheaper because it’s convenient. Bundled solutions often carry higher effective rates that are harder to decompose.
How to verify progress: You have a rough estimate of your total cost of payment acceptance (direct fees plus indirect costs) expressed as a percentage of revenue, and it’s meaningfully higher than your effective rate alone.
Step 5: Evaluate Your Pricing Model Against Your Transaction Profile
Objective: Determine whether your current pricing structure is appropriate for your volume, average ticket size, and card mix.
Flat-rate pricing (e.g., 2.9% + $0.30) is simple and predictable. It’s also almost always more expensive for established businesses processing more than $10,000 per month. The reason: flat-rate pricing charges the same percentage on a debit card transaction (which might carry interchange of 0.5%) as on a rewards credit card transaction (which might carry interchange of 2.1%). You subsidize the expensive transactions with the cheap ones, and the processor keeps the spread.
Interchange-plus pricing exposes the actual interchange cost per transaction and adds a fixed markup.
This model gives you visibility and, for most eCommerce businesses with diverse card mixes, results in a lower effective rate. Tiered pricing (qualified, mid-qualified, non-qualified) is the worst option for transparency because the processor defines which transactions fall into which tier, and those definitions can change without notice.
Your decision here depends on your transaction profile. If your average ticket is high (over $100), the per-transaction fixed fee matters less and the percentage matters more. If you process a significant volume of debit cards, flat-rate pricing is costing you the most. If you receive commercial card orders, interchange-plus with Level 2/3 data optimization offers the largest potential savings. For businesses that process a mix of B2B and B2C orders, routing high-ticket B2B orders to ACH can eliminate card fees on those transactions entirely.
What to avoid: Don’t switch pricing models based solely on the quoted rate. A processor offering interchange-plus at 0.15% + $0.10 sounds cheap, but if they pad interchange categories or add monthly fees that offset the savings, your effective rate may not improve. Always compare effective rates, not quoted rates.
How to verify progress: You can articulate which pricing model you’re on, why it does or doesn’t fit your transaction profile, and what the estimated effective rate difference would be under an alternative model.
Step 6: Build a Data Qualification Strategy
Objective: Ensure your transactions consistently qualify for the lowest available interchange rates by submitting the right data at the right time.
This is where interchange rate reduction moves from theory to practice. For eCommerce merchants, the most impactful data qualification improvements are: ensuring AVS data is passed on every transaction (most gateways do this by default, but verify), settling batches within 24 hours, and submitting enhanced data on commercial card transactions.
Level 2 data requires passing the sales tax amount and a customer code (like a purchase order number) with each transaction. Level 3 data adds line-item detail: product codes, descriptions, quantities, unit costs, and freight amounts. The interchange savings from moving a commercial card transaction from Level 1 to Level 3 can be 0.5% to 1.0% or more per transaction. On a $5,000 B2B order, that’s $25 to $50 saved on a single transaction.
The practical challenge is that most eCommerce platforms don’t submit Level 2 or Level 3 data automatically.
Your payment gateway must support it, your processor must pass it through to the card networks, and your checkout flow must capture the necessary fields. This doesn’t require overhauling your tech stack, but it does require confirming that each link in the chain is functioning. A processor like BAMS can help identify which of your transactions are eligible for enhanced data rates and whether your current setup is actually submitting that data, or just claiming to.
What to avoid: Don’t assume your processor is handling data optimization automatically. Ask them directly: “What percentage of my commercial card transactions qualified at Level 2 or Level 3 interchange last month?” If they can’t answer that question with a specific number, they aren’t tracking it. Also don’t invest in Level 3 data optimization if commercial cards represent less than 5% of your volume. Focus on settlement timing and AVS compliance first, as those affect every transaction.
How to verify progress: You have confirmed whether your gateway supports Level 2/3 data submission, you know what percentage of your transactions are commercial cards, and you have a specific plan (or conversation scheduled with your processor) to improve qualification rates.
Practical Examples: What the Gap Looks Like in Real Numbers
Scenario A: The B2C eCommerce Store That Didn’t Know It Had B2B Orders
An online retailer selling specialty equipment processes $180,000 per month. Their flat-rate processor charges 2.9% + $0.30. Their effective rate, after accounting for all fees, is 3.15%. Monthly processing cost: $5,670.
After auditing their transactions, they discover that 18% of their volume comes from corporate purchasing cards. These transactions are all settling at the highest interchange tier because no Level 2 or Level 3 data is being submitted. By switching to interchange-plus pricing and enabling enhanced data submission on commercial card transactions, their effective rate drops to 2.7%. Monthly processing cost: $4,860. Annual savings: $9,720.
Scenario B: The Growing Store With Creeping Effective Rates
An eCommerce business processing $300,000 per month on interchange-plus pricing notices their effective rate has drifted from 2.5% to 2.8% over 12 months, despite no change in their quoted markup. The cause: their product mix shifted toward higher-priced items purchased more frequently with rewards and premium credit cards, which carry higher interchange. Additionally, a gateway update changed their batch settlement time from same-day to next-day, triggering downgrades on a portion of transactions.
The statement showed the higher costs each month, but nothing on the statement flagged why costs increased. The 0.3% drift, invisible without tracking effective rate over time, cost them $10,800 over the year. Fixing the settlement timing and renegotiating their markup based on their increased volume recovered most of the difference.
Common Mistakes and Pitfalls
Treating the statement as a scorecard instead of a diagnostic tool. Your statement tells you what happened. It doesn’t tell you what should have happened. Without benchmarks and qualification data, you’re grading your own test without an answer key.
Comparing quoted rates across processors without calculating effective rates. A lower quoted rate with higher ancillary fees can easily cost more than a higher quoted rate with fewer extras. Always compare total cost, not headline numbers.
Assuming your processor is optimizing on your behalf. Some processors actively work to ensure your transactions qualify at the best rates. Many don’t. The default assumption should be that no one is watching your interchange qualification unless you’ve specifically confirmed otherwise.
Auditing once and forgetting. Your card mix, transaction sizes, and processor fee schedules change over time. A quarterly review of your effective rate takes 15 minutes and can catch drift before it becomes expensive.
Ignoring off-statement costs. Chargebacks, currency conversion, delayed funding, and compliance fees are real costs that affect your margin. A complete picture of payment processing costs includes everything, not just what appears on one document.
What to Do Next
Start with one action: calculate your effective rate for the last three months. Divide total fees by total volume. Write down the three numbers. If they’re consistent and within the range you expected, you have a baseline. If they’re higher than expected or trending upward, you now have a specific, quantified reason to investigate further.
From there, the next highest-value step is determining whether your statement separates interchange, assessments, and markup. If it doesn’t, you’re making cost decisions without the information you need. That’s a conversation worth having with your processor, and it’s a reasonable expectation of any merchant services relationship built on transparency.
This guide is a reference, not a checklist. Revisit the framework as your business grows, your transaction mix evolves, or your processor changes their fee schedule. The goal isn’t to become a payments expert. It’s to stop accepting a monthly document at face value when it was never designed to tell you the whole story.
Frequently Asked Questions
What is Level 3 data in merchant services?
Level 3 data refers to detailed, invoice-quality transaction information submitted to card networks alongside a payment. It includes line-item details like product descriptions, quantities, unit costs, and freight amounts. When submitted correctly on eligible commercial card transactions, Level 3 data qualifies the transaction for lower interchange rates. Most eCommerce platforms don’t submit this data by default, which means eligible transactions settle at higher rates without the merchant realizing it.
How do I calculate my effective processing rate?
Add up every fee on your processing statement for a given month, including transaction fees, monthly charges, PCI fees, batch fees, and any other line items. Divide that total by your total processing volume for the same month, then multiply by 100. The resulting percentage is your effective rate. Compare it to your quoted rate to see how much of a gap exists. Do this for three consecutive months to identify trends.
Why is my effective rate higher than my quoted rate?
Several factors cause this gap. Interchange downgrades (when transactions fail to meet data or timing requirements) push individual transactions to more expensive rate categories. Monthly fixed fees, PCI compliance charges, and batch fees add to your total cost without being reflected in the per-transaction rate. On flat-rate pricing, the processor’s built-in margin on low-interchange transactions (like debit cards) is invisible. All of these inflate your effective rate above the advertised number.
Which types of transactions are eligible for Level 3 interchange rates?
Level 3 interchange rates apply primarily to commercial card transactions, including corporate purchasing cards, business credit cards, and government procurement cards. Consumer credit and debit cards are not eligible for Level 3 rates. However, many eCommerce merchants don’t realize they’re receiving commercial card orders because the cards look identical during checkout. Identifying your commercial card volume is the first step toward determining whether Level 3 optimization is worth pursuing.
What’s the difference between flat-rate and interchange-plus pricing?
Flat-rate pricing charges a single, uniform percentage (plus a fixed per-transaction fee) regardless of the underlying interchange cost. Interchange-plus pricing shows you the actual interchange rate for each transaction and adds a fixed markup on top. Interchange-plus provides more transparency and typically results in lower effective rates for businesses processing over $10,000 per month, because you benefit directly when transactions qualify at lower interchange tiers rather than subsidizing expensive card types.
How often should I audit my processing statement?
A full audit (calculating effective rate, checking for downgrades, reviewing all fee line items) is worth doing quarterly. A quick effective-rate check takes about 15 minutes and should happen monthly. Your card mix, average ticket size, and processor fee schedules can all shift over time, and even small changes compound into meaningful cost increases if left unchecked for a year.