Cash Flow Forecasting for Daily Deposits
Last Updated on July 10, 2026 by Dimitri Akhrin
How to rebuild your eCommerce forecasting model when deposit timing changes break your numbers
Learn why switching to daily funding breaks weekly cash flow forecasting models and how to fix it. This guide walks eCommerce managers through rebuilding inputs, assumptions, and liquidity tracking for real-time financial insights.
TL;DR
- Daily deposits break weekly forecast models – Your opening cash balance now changes every morning, and weekly time buckets hide critical intra-week liquidity gaps. The fix is a model rebuild, not more discipline with the old model.
- Audit your actual settlement timeline first – Match 30 days of transactions to bank deposits. Know your processor’s exact cutoff time and weekend gaps before you change anything else in your forecast.
- Use hybrid time buckets – Daily rows for inflows over the next 14 days, weekly rows for weeks 3 through 13, and outflows placed on the specific day they clear your account.
- Reconcile every morning – Verify your actual bank balance against yesterday’s projection and adjust all forward numbers. Small daily variances compound into large weekly errors if ignored.
- Build decision triggers, not just projections – Set specific cash position thresholds for inventory reorders, ad spend changes, and early payment discounts so your forecast drives action rather than just reporting numbers.
Guide Orientation: What This Covers and Who It’s For
This guide is about rebuilding your cash flow forecasting model when your eCommerce business shifts from weekly processor deposits to daily funding. It is not a general primer on budgeting or saving. It is a specific, structural walkthrough for eCommerce managers who already forecast cash flow but whose numbers have started drifting since deposit timing changed.
By the end, you’ll understand exactly why daily deposits break a weekly forecasting model, which inputs and assumptions need to change, and how to rebuild a forecast that gives you real-time financial insights into liquidity you can actually act on. If you manage cash flow at an established online business (roughly 10 to 50 employees), this is written for you.
We won’t cover long-term capital planning, fundraising strategy, or basic accounting definitions. We stay inside the operational window where deposit timing, inventory purchasing, and daily cash position intersect.
Why Cash Flow Forecasting Breaks When You Accelerate Cash Inflows
Most eCommerce cash flow models were built around a simple rhythm: sales accumulate over several days, a deposit lands midweek or early the following week, and you plan outflows against that lump arrival. The model works because the timing is predictable and the granularity is coarse enough that small variances wash out over a weekly bucket.
When you switch to daily funding (or next-day deposits), that rhythm disappears. Instead of one or two deposit events per week, you now have five to seven. Each deposit corresponds to a single day’s sales rather than an aggregated batch. Your opening cash balance shifts every morning. And the variance that used to average out across a week now shows up as a daily surprise.
This isn’t a discipline problem. It’s a model problem. According to the U.S. Small Business Administration, strong cash flow management helps businesses prepare for expenses, avoid shortfalls, and make better operational decisions. The risk compounds when your model’s assumptions about deposit timing no longer match reality. You don’t need to try harder at the old model. You need a different model.
The cost of inaction is tangible: you either sit on cash you could reinvest in inventory, or you commit cash you don’t yet have because your forecast told you it would be there. Both outcomes erode margin. The fix starts with understanding what actually changed in your inputs.
As payment systems continue to evolve toward faster settlement and improved cash availability, businesses are increasingly expected to make financial decisions using more current cash position data rather than relying solely on historical reporting cycles, according to information published by the Federal Reserve.
Core Concepts: What Changes When Deposits Go Daily
Opening Balance Volatility
In a weekly model, your opening balance resets once. In a daily model, it resets every morning. This means your forecast’s starting point (the number everything else is calculated from) is now a moving target. Without a reconciled cash view, your opening cash cannot be trusted. Daily deposits make reconciliation a daily requirement, not a weekly one.
Granularity Mismatch
Your outflows (supplier payments, payroll, ad spend, SaaS subscriptions) likely still operate on weekly, biweekly, or monthly cycles. But your inflows now arrive daily. This creates a granularity mismatch: one side of the ledger is high-resolution and the other is low-resolution. Your forecast needs to handle both without forcing one into the other’s time bucket.
The Settlement Lag Illusion
Daily funding doesn’t mean instant funding. There’s still a settlement window, typically one business day. A sale on Tuesday deposits Wednesday. A Friday sale may not land until Monday. If your forecast treats “daily” as “same-day,” you’ll overcount available cash on any given morning. Understanding your processor’s actual cutoff times and settlement schedule is a prerequisite, not a detail.
Forecasting vs. Tracking
A common misconception: checking your bank balance every morning is not forecasting. Forecasting means projecting forward based on expected inflows and committed outflows. Tracking tells you where you are. Forecasting tells you where you’ll be. Daily deposits make tracking easier but forecasting harder, because the inputs move faster than most models update.
Many small businesses continue to identify cash flow management and operating expenses as significant financial challenges, according to the Federal Reserve’s 2025 Small Business Credit Survey. Improving visibility into daily cash position can help reduce uncertainty around operational decisions.
The Framework: A Four-Phase Model Rebuild
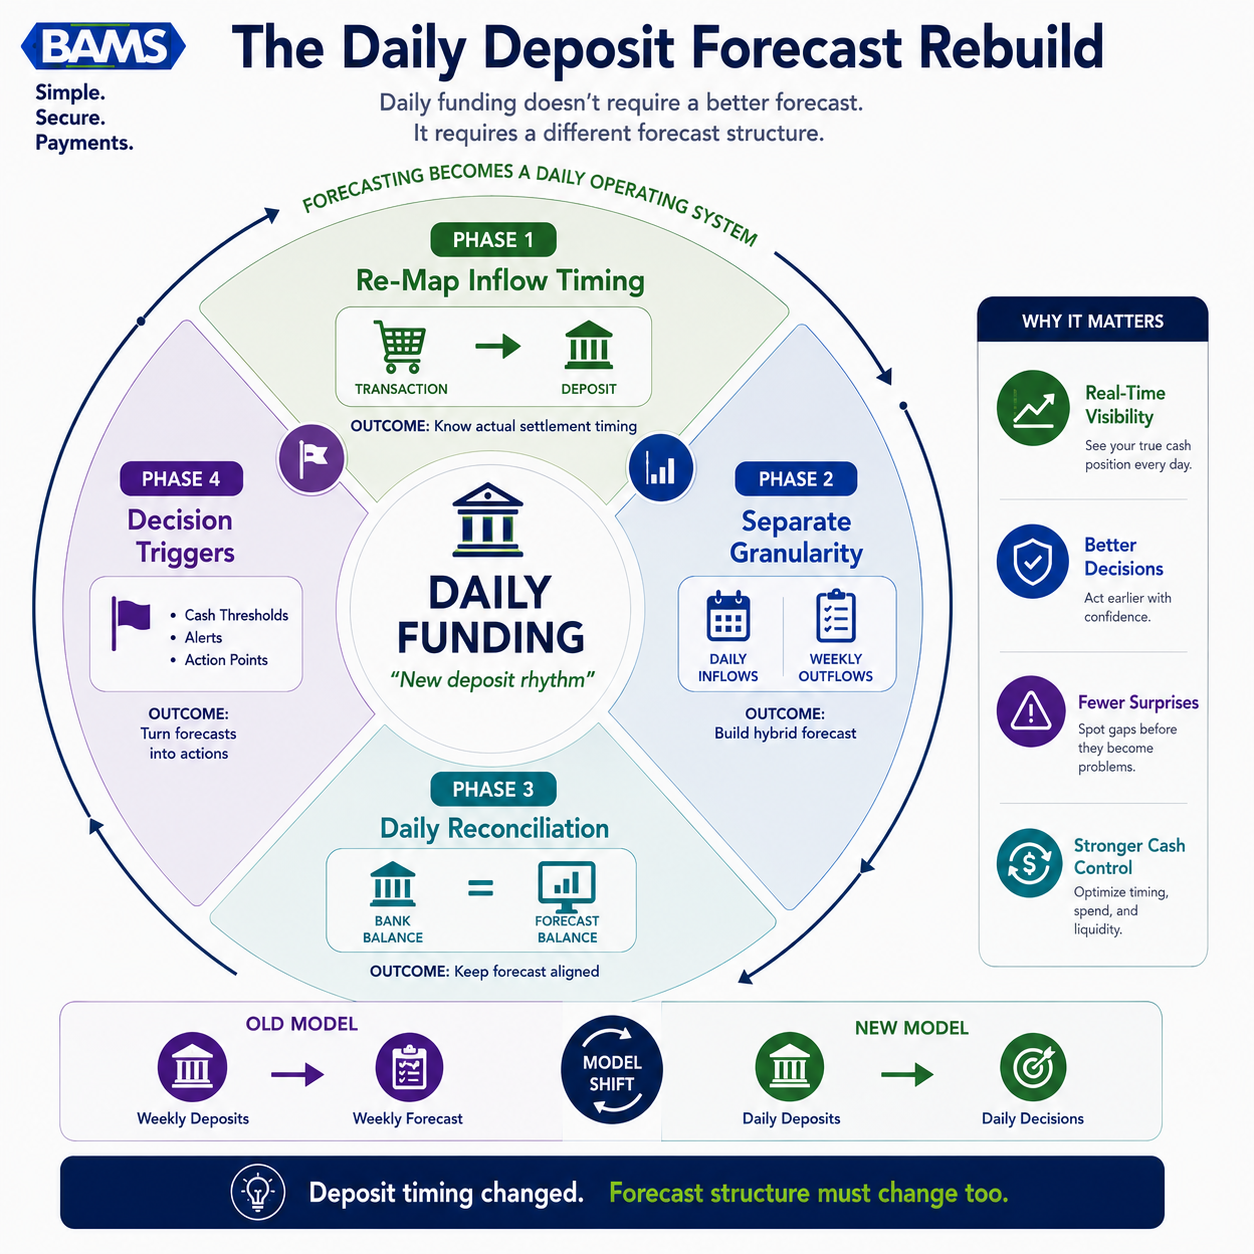
Daily funding doesn’t require a better forecast. It requires a different forecast structure.
Rebuilding your forecast for daily deposits follows four phases. Each phase addresses a specific structural gap between your old model and your new deposit reality.
- Phase 1: Re-Map Your Inflow Timing — Align your forecast inputs to your processor’s actual settlement schedule, not your old deposit assumptions.
- Phase 2: Separate Inflow and Outflow Granularity — Build a model that handles daily inflows alongside weekly or monthly outflows without collapsing one into the other.
- Phase 3: Establish a Rolling Daily Reconciliation — Create a daily opening-balance discipline that keeps your forecast anchored to reality.
- Phase 4: Build Decision Triggers, Not Just Projections — Use your forecast to drive specific actions (inventory orders, ad spend adjustments) based on cash position thresholds.
These phases are sequential for the initial rebuild, but once established, Phases 3 and 4 become ongoing daily and weekly practices. The goal is a forecast that updates with your deposit rhythm rather than fighting against it.
Step-by-Step: Rebuilding Your Cash Flow Forecast for Daily Deposits
Step 1: Audit Your Actual Settlement Timeline
Objective: Know exactly when money from each day’s sales arrives in your bank account, down to the day and the cutoff time.
Start by pulling 30 days of transaction data from your payment processor and matching each batch to its corresponding bank deposit. You’re looking for the actual lag between transaction time and deposit time, not the lag your processor’s marketing materials promise. Note the cutoff time (the hour after which transactions roll into the next day’s batch) and any weekend or holiday patterns.
For example, if your processor has a 9 PM EST cutoff and funds next business day, a transaction at 8:55 PM Tuesday deposits Wednesday. A transaction at 9:05 PM Tuesday deposits Thursday. That one-hour difference shifts your available cash by a full day. Understanding how payout timing works at this level of specificity is the foundation everything else builds on.
Anti-pattern: Assuming “next-day funding” means every sale deposits the next calendar day. It means the next business day after the cutoff, which creates a two-to-three-day gap over weekends.
Success indicator: You can predict, for any given transaction timestamp, exactly which day its funds will appear in your bank account. If you can’t do this with 95%+ accuracy for the last 30 days, your forecast will drift from day one.
Step 2: Restructure Your Forecast Time Buckets
Objective: Move from weekly time buckets to a hybrid model that uses daily buckets for inflows and retains appropriate buckets for outflows.
The standard 13-week forecast with weekly time buckets is widely used for short-term liquidity management. But when your inflows arrive daily, weekly buckets hide critical information. A week where $35,000 arrives evenly across five days looks identical to a week where $28,000 arrives Monday through Thursday and $7,000 arrives Friday, but the cash available for a Wednesday supplier payment is very different in each scenario.
Build a spreadsheet (or model) with daily rows for at least the next 14 days, then weekly rows for weeks 3 through 13. On the inflow side, each daily row gets a projected deposit based on your sales forecast and the settlement lag from Step 1. On the outflow side, place each committed payment on the specific day it will clear your account, not the day it’s “due.”
Anti-pattern: Converting everything to daily buckets, including outflows that only happen monthly. This creates noise without insight. Keep outflow granularity matched to outflow frequency.
Success indicator: Your 14-day forward view shows a different cash position for each day, and you can identify the specific day with the lowest projected balance (your liquidity trough) within any given week.

Daily deposits require daily visibility without creating unnecessary forecasting complexity.
Step 3: Build a Daily Opening Balance Reconciliation
Objective: Start each day’s forecast from a verified, reconciled cash position rather than yesterday’s projection.
This is where most eCommerce teams skip a step and pay for it later. According to SBA guidance, accurate financial recordkeeping and cash management practices are critical for maintaining reliable business forecasts and operational visibility. When you’re updating daily, those errors compound fast. Your morning routine needs to include three checks: (1) verify the actual bank balance, (2) confirm yesterday’s projected deposit matched the actual deposit, and (3) adjust today’s opening balance in your forecast accordingly.
If yesterday’s deposit was $12,400 and you projected $13,100, that $700 variance needs to flow through every subsequent day’s projection. Don’t just note it and move on. Adjust the forward numbers. This is the difference between a forecast that drifts 5% per week and one that stays within 1-2%.
Connecting your forecast to live bank feeds or your accounting system dramatically reduces the manual effort here. Forecasting accuracy improves measurably when built on live data rather than month-old reports. If your current tools don’t support this, a daily 10-minute reconciliation in a spreadsheet is the minimum viable alternative.
Anti-pattern: Reconciling weekly “because the variances are small.” Small daily variances become large weekly variances. A $500/day miss becomes a $2,500 gap by Friday.
Success indicator: Your projected opening balance matches your actual bank balance within 2% on at least 12 of the last 14 days.
Step 4: Map Outflows to Inflow Cadence
Objective: Align your payment timing to your deposit rhythm so you’re spending cash you have, not cash you expect.
With daily deposits, you have a new lever most eCommerce operators underuse: you can time outflows to land on days when your cash position is strongest. Review your top 10 outflows by dollar amount and categorize them as fixed-date (payroll, rent, loan payments) or flexible-date (inventory orders, ad spend top-ups, supplier payments with net terms).
For flexible-date outflows, shift them to the day of the week when your cumulative deposits create the highest cash position. If your heaviest sales days are Sunday through Tuesday (common in eCommerce), your strongest cash position after settlement is typically Tuesday through Thursday. Schedule flexible payments for Wednesday or Thursday rather than Monday.
This isn’t about delaying payments. It’s about matching payment timing to deposit timing so your forecast’s projected low point (the liquidity trough from Step 2) stays above your minimum cash buffer. If you’re using a processor that offers next-day funding with a late cutoff time, you can capture more of Tuesday’s sales in Wednesday’s deposit, giving you a larger base before Thursday’s payments clear.
Anti-pattern: Treating all outflows as fixed. If you’re paying suppliers on the same day every week regardless of cash position, you’re leaving flexibility on the table.
Success indicator: Your projected daily low point (minimum cash balance on any given day) is at least 15-20% higher than it was under your old timing structure, without changing total spending.
Step 5: Build Forecast-Driven Decision Triggers
Objective: Convert your forecast from a reporting tool into a decision-making tool with specific thresholds that prompt action.
A forecast that tells you “cash will be $47,000 on Thursday” is informative. A forecast that tells you “cash will be $47,000 on Thursday, which is above your $40,000 reorder threshold, so you can place the inventory order” is actionable. Define three to five cash position thresholds tied to specific operational decisions.
Common triggers for eCommerce operators include:
- Inventory reorder threshold: The minimum cash position required before placing a restocking order. Below this, delay the order one day and re-check.
- Ad spend acceleration threshold: The cash position above which you increase daily ad budget. Below it, hold at baseline.
- Early payment discount threshold: The cash position above which you take supplier early-payment discounts (typically 1-2% for paying 20 days early). Below it, pay at net terms.
- Emergency buffer threshold: The cash position below which you freeze all discretionary spending and investigate the variance.
These triggers turn daily deposits from a data stream into a decision engine. Because even a one-day delay in a large inflow or outflow can matter, your triggers should be checked daily against your reconciled opening balance.
Anti-pattern: Setting thresholds once and never adjusting them. Your thresholds should reflect your current sales velocity, not last quarter’s. Review monthly.
Success indicator: At least three operational decisions per week are made based on forecast thresholds rather than gut feel or checking the bank balance.
Step 6: Incorporate Sales Forecast Variance Into Cash Projections
Objective: Account for the fact that your daily sales forecast is less accurate than your weekly sales forecast, and build that uncertainty into your cash projections.
Here’s the math problem daily deposits create: forecasting total weekly sales within 5% is achievable for most established eCommerce businesses. But forecasting any single day’s sales within 5% is much harder. Daily variance in eCommerce is driven by factors like email campaign timing, social media virality, competitor promotions, and even weather. A single day might swing 15-25% from your projection.
Handle this by forecasting daily inflows as a range rather than a point estimate. Use your last 60 days of daily sales data to calculate the average daily variance (standard deviation divided by mean). Apply that variance to create a “likely low” and “likely high” projection for each day’s deposit.
Your decision triggers from Step 5 should reference the “likely low” projection, not the midpoint. This builds a natural conservatism into your operating decisions without requiring you to maintain a larger idle cash buffer. You’re using the forecast’s uncertainty to protect against downside rather than padding the bank account.
Anti-pattern: Using a single-point daily sales estimate and treating it as certain. This is the fastest way to overspend on a slow sales day.
Success indicator: Your actual daily deposits fall within your projected range at least 80% of the time over a 30-day period.
Practical Examples: Before and After the Model Rebuild
Scenario: Mid-Size Apparel eCommerce Store
Consider an online apparel business doing $180,000/month in revenue. Under their old model with 3-day settlement, they received roughly two deposits per week, averaging $20,000-$25,000 each. Their forecast used weekly buckets. Inventory orders went out every Monday. The model worked because the deposit pattern was stable enough that weekly granularity captured the cash position adequately.
After switching to a processor offering next-day funding, they started receiving five deposits per week averaging $6,000-$9,000 each. Their weekly forecast still showed the same total inflow, but it couldn’t tell them whether Wednesday’s cash position supported an emergency restock of a trending product. By the time Friday’s weekly review happened, the trending item was sold out and the restock window had closed.
After the Rebuild
With a daily-bucket forecast and decision triggers, the same business can now see by Tuesday morning that their projected Wednesday cash position (using the “likely low” estimate) exceeds the inventory reorder threshold. They place the restock order Wednesday, receive goods Friday, and capture weekend demand. The total cash spent is identical. The timing is what changed, and timing is what daily deposits give you control over.
This is where BAMS becomes relevant as a merchant services partner: their next-day funding with a 9 PM EST cutoff means this apparel business captures more of each day’s sales in the next morning’s deposit, widening the window for time-sensitive inventory decisions. The forecasting model only works if the deposit timing is reliable and fast enough to act on.
Edge Case: Promotional Spikes
During a flash sale, daily revenue might triple. Under a weekly model, that spike blends into the weekly total and the excess cash sits idle until the next planning cycle. Under a daily model with decision triggers, the operator sees the surplus the next morning and can immediately redirect it: accelerate ad spend, take an early-payment discount from a supplier, or pre-order inventory for the next promotion. The forecast doesn’t just record the spike. It converts it into a decision.
Common Mistakes and Pitfalls
Over-engineering the model. Daily forecasting doesn’t mean you need enterprise treasury software. A well-structured spreadsheet with daily reconciliation works for most eCommerce businesses under $500K/month. Add complexity only when the current model stops answering your questions.
Ignoring processor fee timing. Your processor deducts fees from deposits (or charges them monthly). If fees are deducted per-transaction, your daily deposit is net of fees. If they’re charged monthly, you have a large outflow once a month. Your forecast needs to reflect whichever structure your processor uses.
Confusing cash position with profitability. A strong daily cash position doesn’t mean you’re profitable. It means you have liquidity. Keep your P&L analysis separate from your cash flow forecast. They answer different questions.
Abandoning the model during calm periods. Short-term forecasts need weekly or even daily updates to stay accurate. The model is most valuable during stable periods because that’s when you build the baseline data that makes spike detection possible.
What to Do Next
Start with Step 1. Pull 30 days of transaction data and match each batch to its bank deposit. This single exercise will show you whether your current forecast assumptions about deposit timing are accurate. If they’re off by even one day on average, your entire forward projection is shifted.
You don’t need to rebuild the whole model in a week. Audit settlement timing this week. Restructure your time buckets next week. Add daily reconciliation the week after. Each phase improves accuracy incrementally, and you’ll see the benefit in your cash position visibility within the first two weeks.
Revisit this guide as your sales volume changes or if you switch processors. The framework holds, but the specific numbers (thresholds, variance ranges, settlement lags) need to reflect your current operating reality. Treat this as a living reference, not a one-time project.
Frequently Asked Questions
What is a cash flow acceleration strategy?
A cash flow acceleration strategy is any approach that shortens the time between earning revenue and having that cash available in your bank account. For eCommerce businesses, the most direct lever is switching to a payment processor that offers next-day funding instead of the standard 2-5 day settlement. The strategy also includes timing your outflows to match your inflow cadence, so you spend cash when your position is strongest rather than on arbitrary calendar dates.
How can businesses improve cash flow forecasting with real-time data?
Connect your forecast model to live bank feeds or your accounting platform so your opening balance updates automatically each morning. This eliminates the most common source of forecast drift: a stale starting number. If direct integration isn’t available, a manual 10-minute daily reconciliation (checking actual deposits against projected deposits and adjusting forward projections) achieves most of the same accuracy improvement.
Why is optimizing merchant services important for cash flow?
Your payment processor controls when you receive your revenue. A processor with a late cutoff time and next-day settlement gives you access to funds one to four days faster than one with standard timing. That difference directly affects your ability to reorder inventory, fund ad spend, and take supplier discounts. It also changes the structure of your forecast, because deposit timing is the single largest input on the inflow side of any eCommerce cash flow model.
Do I need special software to forecast cash flow daily?
No. A well-structured spreadsheet with daily rows for the next 14 days and weekly rows for weeks 3 through 13 works for most eCommerce businesses processing under $500K/month. The critical requirement is discipline (daily reconciliation and variance tracking), not software. If you outgrow a spreadsheet, look for tools that connect to your bank feeds and allow daily time buckets, but start simple.
How do weekend and holiday settlement gaps affect daily forecasts?
Most processors don’t settle on weekends or bank holidays. This means Friday, Saturday, and Sunday sales typically deposit on Monday (or Tuesday after a holiday weekend). Your forecast needs to account for this by projecting a larger Monday deposit and zero deposits on weekends. Failing to model this creates a recurring forecast error every week, where your weekend cash position appears lower than expected and your Monday position appears higher.
When should I consider offering early payment discounts to suppliers?
Consider it when your daily forecast consistently shows your cash position above your early-payment-discount threshold (defined in your decision triggers) and the discount rate exceeds your cost of capital. A typical 2/10 net 30 discount (2% off for paying 20 days early) annualizes to roughly 36% return, which almost always exceeds the cost of holding that cash. But only take the discount when your forecast confirms you won’t dip below your emergency buffer as a result.