Payment Decline Signals: A Recovery Guide for eCommerce
Last Updated on October 1, 2026 by Dimitri Akhrin
How to diagnose false declines, recover lost revenue, and turn faster deposits into real growth
Learn how to read payment decline signals like a cash flow report and recover revenue lost to false declines. This guide walks eCommerce managers through decline diagnosis, retry strategy, and deposit acceleration — all actionable this week.
TL;DR
- False declines silently drain revenue – Issuing banks block about 15% of legitimate eCommerce orders, and for every $1 of actual fraud stopped, $25 of real customer payments are falsely declined. Most eCommerce managers don’t track this number.
- Soft declines are recoverable – Up to 80–90% of all declines are temporary (insufficient funds, bank timeouts, generic refusals). A structured retry schedule with proper timing can recover 40–70% of that lost revenue.
- Better data reduces false declines at the source – Sending complete transaction information (AVS, CVV, 3DS2) and calibrating your fraud filter thresholds to match your actual risk profile can move your authorization rate from the 85% range toward 93–95%.
- Faster deposits turn recovered revenue into working capital – Moving from 3-day settlement to next-day funding frees up thousands in cash you can reinvest in inventory, ads, and fulfillment instead of waiting on your processor.
- Start with one action: pull your decline report – Calculate your authorization rate, put a dollar figure on your recoverable declines, and use that number to prioritize every subsequent improvement. Revisit quarterly.
Guide Orientation: What This Covers and Who It’s For
This guide shows you how to identify and recover eCommerce revenue lost to false declines, then reinvest that recovered cash flow into growth. Every wrongly declined transaction is revenue your business already earned but never received. We treat payment decline signals as an operational problem you can diagnose and fix this week, not a technical puzzle that requires a payments engineer.
This is written for eCommerce managers at established online businesses (roughly 10–50 employees) who feel the squeeze of delayed deposits, inconsistent transaction approval rates, and processing fees that seem disconnected from value. By the end, you’ll be able to read your decline data like a cash flow report, implement a structured recovery process, and turn faster deposits into a genuine growth lever for your business.
What’s included: decline diagnosis, retry strategy, chargeback prevention, deposit acceleration, and a framework for connecting all four. What’s excluded: enterprise payment orchestration, multi-acquirer routing architectures, and deep fraud-modeling techniques.
Why Payment Decline Signals Matter More Than You Think
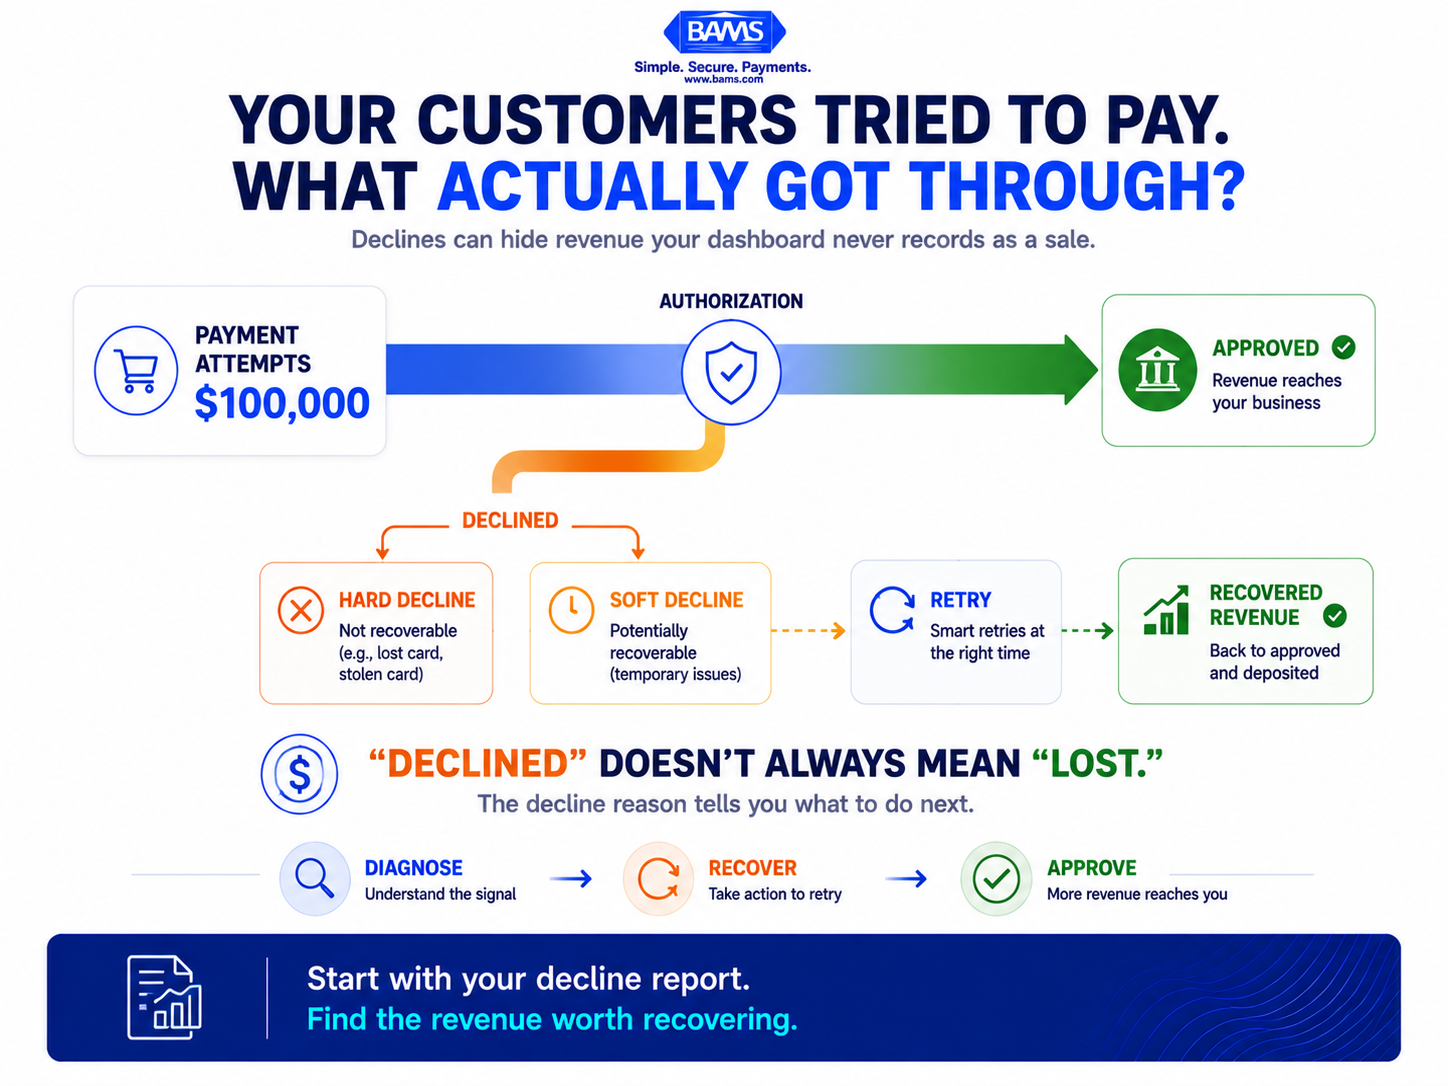
Not every declined payment is a bad customer or fraudulent transaction. Your decline data can reveal legitimate revenue being blocked at checkout.
For most growing eCommerce operations, “payment declined” is a line item nobody investigates. The order didn’t go through, the customer presumably tried again or left, and the team moves on. That passivity can be expensive.
Not every declined transaction represents fraud. Visa specifically identifies false declines as a source of payment friction and highlights the importance of distinguishing genuine transactions, reducing unnecessary declines, and identifying appropriate retry strategies. For eCommerce businesses, that means a declined payment should be treated as a signal to investigate, not automatically written off as a lost or fraudulent order.
The cost extends beyond the individual transaction. A legitimate customer who cannot complete a purchase may abandon the checkout entirely, creating lost revenue and unnecessary friction at the point of highest purchase intent. Understanding why transactions are being declined is therefore part of both payment optimization and customer experience.
Meanwhile, the cash you do collect often sits in a settlement queue for two to three business days, limiting what you can reinvest in inventory, marketing, or fulfillment. When you combine blocked revenue with delayed deposits, you get a cash flow profile that looks weaker than your actual business performance. That gap between earned revenue and received revenue is the growth lever most eCommerce managers overlook.
The good news: you don’t need to overhaul your payment stack. You need to read the signals your processor is already sending you, act on them systematically, and choose partners whose funding speed matches your operational tempo.
Core Concepts: Understanding the Revenue You’re Losing
False Declines vs. Fraud Blocks
A fraud block stops a genuinely fraudulent transaction. A false decline stops a legitimate customer whose transaction is incorrectly rejected. The distinction matters because fraud controls have to balance protection with payment acceptance. Visa’s payment optimization guidance specifically emphasizes filtering genuine transactions, reducing friction from false declines, and finding appropriate options for retries while still combating fraud.
Hard Declines vs. Soft Declines
A hard decline generally indicates a payment issue that should not simply be retried, while a soft decline may result from a temporary condition that could be recoverable. Understanding the difference matters because the appropriate response varies by decline reason. Visa identifies retry optimization as an important part of reducing payment friction, alongside verification and authorization improvements designed to help legitimate transactions succeed.
Authorization Rate as a Health Metric
Transaction approval rates (also called authorization rates) measure the percentage of attempted payments that are successfully authorized. If you don’t know your current number, that’s the first thing to fix. Visa notes that payment optimization can involve improving verification, authorization, transaction routing, and retry strategies to reduce payment friction and improve approvals. Even a 3-point improvement on $500,000 in monthly attempted volume represents $15,000 in additional approved transactions.
Deposit Speed as a Growth Input
Settlement timing determines when approved revenue becomes usable cash. Standard processing holds funds for 48–72 hours. Delayed payment deposits aren’t a technical necessity. They’re a business model choice by your processor. Every day your cash sits in transit is a day you can’t deploy it toward growth.
The Framework: Diagnose, Recover, Accelerate, Reinvest
This guide follows a four-stage framework designed for eCommerce managers who need results without a dedicated payments team. Each stage builds on the previous one.
- Diagnose: Read your decline data to separate fixable problems from noise.
- Recover: Implement retry logic and customer recovery flows that recapture soft-declined revenue.
- Accelerate: Reduce the time between authorization and usable cash in your account.
- Reinvest: Channel recovered revenue and faster deposits into the growth activities that compound (inventory, ads, fulfillment capacity).
These stages are sequential for first implementation but cyclical in practice. Once you’ve built the system, you revisit Diagnose monthly, refine Recovery quarterly, and evaluate Acceleration whenever you renegotiate processor terms. The interconnection is important: faster deposits without better approval rates just accelerates a fraction of what you should be earning. Higher approval rates without faster deposits still leave cash trapped in settlement. You need both.
Step-by-Step: Building Your Decline-to-Growth System
Step 1: Audit Your Decline Data (Diagnose)
Objective: Know your current authorization rate, identify your top three decline reasons by volume, and quantify the revenue at stake.
Start by pulling your decline report from your payment gateway or processor dashboard. Most platforms provide decline reason codes that help identify why individual transactions were unsuccessful. You’re looking for the distribution across categories such as insufficient funds, expired or cancelled cards, issuer declines, and suspected fraud. Visa explains that the issuing bank ultimately approves or declines a transaction after checking factors such as available funds and whether the transaction passes its authorization checks. Your own decline data is more useful than a generic industry average because it shows which problems are actually affecting your customers.
Calculate the dollar value of each category. Multiply the number of declined transactions by your average order value. This gives you a revenue-at-risk figure for each decline type. Write it down. This number is your baseline, and it’s the number you’ll use to justify every subsequent action in this guide.
Pay special attention to the “do not honor” and “suspected fraud” categories. These are where false declines hide. If these codes represent more than 10% of your total transactions, your processor’s risk settings may be too aggressive for your customer profile.
Anti-patterns: Don’t average your decline rate across all payment methods. Card-not-present transactions decline at higher rates than digital wallets. Averaging masks the problem. Don’t ignore small-dollar declines either. They represent real customers who may never return.
Success indicators: You can state your authorization rate to one decimal point. You have a ranked list of decline reasons with dollar values attached. You’ve identified which categories are recoverable (soft declines) and which are not (hard declines).
Step 2: Build a Soft-Decline Recovery Workflow (Recover)
Objective: Recapture 40–70% of soft-declined revenue through structured retry logic and customer communication.
Soft declines can present an opportunity for recovery, but retrying every failed payment in the same way is not an effective strategy. Visa specifically identifies finding the right options for retries as part of payment optimization. Effective recovery therefore requires a deliberate sequence based on the decline reason rather than repeatedly submitting the same transaction without context.
For automated retries, space attempts across different times of day. An “insufficient funds” decline at 2 PM may succeed at 10 AM on payday. Most gateways allow you to configure retry schedules. Set your first retry for 24 hours after the initial decline, the second for 72 hours, and a third at the 7-day mark. For subscription or recurring billing, this cadence is especially important because an unresolved payment failure can interrupt an otherwise active customer relationship.
Pair automated retries with a customer-facing email. Keep it simple: “We had trouble processing your payment. Please update your card details or try again.” Include a direct link to complete the purchase. Don’t mention fraud. Don’t use alarming language. Treat it as a minor hiccup, because for the customer, it is.
For “do not honor” declines, consider offering an alternative payment method at the point of failure. Apple Pay, Google Pay, and PayPal often route through different networks and may succeed where a direct card charge didn’t.
Anti-patterns: Don’t retry hard declines (expired cards, closed accounts). You’ll increase your processor’s decline ratio and potentially trigger monitoring. Don’t send more than two recovery emails. Beyond that, you’re creating friction, not recovering revenue.
Success indicators: You have an automated retry schedule configured in your gateway. You’ve created a recovery email template. You’re tracking recovery rate (successful retries divided by total soft declines) as a weekly metric.
Step 3: Reduce False Declines at the Source (Recover)
Objective: Lower the rate at which legitimate transactions are blocked before they ever reach your retry workflow.
False declines happen when risk signals look suspicious to the issuing bank. You can influence this by sending better data with each transaction. Most payment gateways allow you to pass additional fields: billing address, CVV, customer email, device fingerprint, and shipping address. The more data the issuer receives, the more confidently it can approve the transaction.
Review your checkout flow for data completeness. If you’re not collecting and transmitting AVS (Address Verification System) data, start. If your gateway supports 3D Secure 2.0, enable it selectively for transactions that are flagged as medium-risk. 3DS2 shifts liability to the issuer and often improves approval rates because the bank gets direct authentication from the cardholder.
Examine your fraud protection measures and risk thresholds. Many processors ship with conservative default settings designed for the average merchant, not your specific customer base. If your typical order is $45 and your fraud rate is below 0.5%, you likely don’t need the same risk sensitivity as a merchant selling $2,000 electronics. Ask your processor to review and adjust your risk parameters. If they can’t or won’t have that conversation, that’s a signal about the relationship.
That balance matters because eCommerce risk extends well beyond a single fraud metric.
The National Retail Federation highlights payment fraud and chargebacks as part of a broader eCommerce loss landscape and emphasizes the value of using data to understand and manage those risks. The goal is not simply to make fraud controls stricter, but to understand where losses occur and apply controls where they are actually needed.
Tools like BAMS pair dedicated account management with proactive chargeback defense, which means a real person reviews your risk profile and adjusts settings based on your actual transaction patterns rather than industry averages. This kind of hands-on calibration is often the difference between a 87% and a 94% authorization rate.
Anti-patterns: Don’t disable fraud filters entirely to chase a higher approval rate. The goal is calibration, not elimination. Don’t assume your current settings are correct just because you haven’t had a major fraud incident. Conservative settings hide their cost in invisible lost sales.
Success indicators: You’ve verified that AVS and CVV data are being transmitted with every transaction. You’ve reviewed your risk thresholds with your processor. Your false decline rate (“do not honor” and “suspected fraud” codes on legitimate orders) is trending downward.
Step 4: Accelerate Deposit Timing (Accelerate)
Objective: Reduce the gap between a successful authorization and cash available in your operating account.
Standard settlement cycles of 48–72 hours exist because they benefit the processor, not because they’re technically necessary. Faster deposits for eCommerce are available and increasingly common, but many merchants don’t know to ask for them or assume they carry prohibitive fees.
Start by understanding your current settlement schedule. Log into your processor dashboard and check: when does your batch close, and when do funds appear? If your batch closes at midnight but your bank receives the deposit file at noon the next day, you’re already losing half a business day to processing lag.
Next, evaluate next-day funding options. Some processors offer this as a standard feature. Others charge a premium. Calculate the value of having cash one or two days sooner. If your monthly revenue is $200,000 and you’re currently on a 3-day settlement, moving to next-day funding frees up roughly $20,000 in working capital at any given time. That’s $20,000 you can put into inventory, ad spend, or payroll without touching a credit line.
Optimize your batch submission timing. Transactions authorized after your batch cutoff time roll into the next day’s settlement. If your cutoff is 5 PM EST and a significant portion of your sales happen in the evening, you’re adding an extra day to those deposits. Some processors allow you to adjust cutoff times or run multiple batches per day.
Anti-patterns: Don’t evaluate deposit speed in isolation from processing cost. A processor offering next-day funding at interchange-plus pricing may be cheaper overall than one with 2-day funding on tiered pricing. Compare total cost of processing, not just the funding speed line item.
Success indicators: You know your current batch cutoff time and average settlement delay. You’ve requested next-day funding terms from your processor. You can calculate the working capital freed by faster deposits.
Step 5: Defend Revenue with Proactive Chargeback Prevention (Accelerate)
Objective: Prevent chargebacks from clawing back revenue you’ve already earned and deposited.
Chargebacks are the mirror image of false declines. Where false declines block revenue before you receive it, chargebacks remove revenue after you’ve received it. Both are cash flow drains, and both respond to proactive management.
The challenge is becoming more complex as digital commerce grows. The Merchant Risk Council’s 2025 coverage of chargebacks and fraud highlights the growing sophistication of online fraud and the operational challenge merchants face in managing fraud prevention and chargeback costs. This makes ongoing monitoring and data-driven fraud controls increasingly important for eCommerce merchants.
The most effective chargeback prevention starts before the dispute is filed. Use clear billing descriptors so customers recognize the charge on their statement. “MYBRAND.COM” is better than “PROC*8837291.” Send order confirmation and shipping notification emails promptly. Provide easy-to-find contact information so a confused customer calls you before calling their bank.
Enroll in chargeback alert services (Ethoca, Verifi CDRN) if your processor supports them. These services notify you when a customer initiates a dispute, giving you a window to issue a refund before it becomes a formal chargeback. A refund costs you the transaction amount. A chargeback costs you the transaction amount plus a fee (typically $15–$25), plus damage to your chargeback ratio, which can trigger higher processing rates or account termination.
Track your chargeback ratio monthly. The card networks flag merchants above 1% of transactions. If you’re approaching 0.7%, treat it as a red alert and investigate the root causes. Common culprits: unclear return policies, slow shipping without tracking updates, and subscription billing that customers forget they authorized.
Anti-patterns: Don’t treat chargebacks as a cost of doing business. Each one erodes your processor relationship and your margins. Don’t fight every chargeback through representment. Focus representment efforts on high-value disputes where you have strong evidence (delivery confirmation, customer communication logs).
Success indicators: Your billing descriptor is clear and recognizable. You’re enrolled in at least one chargeback alert service. Your chargeback ratio is below 0.5% and you’re tracking it monthly.
Step 6: Reinvest Recovered Revenue into Growth (Reinvest)
Objective: Channel the cash flow improvements from Steps 1–5 into activities that compound your eCommerce revenue.
This is where the “growth lever” part of the equation becomes tangible. Suppose your monthly transaction volume is $300,000. You improve your authorization rate from 87% to 93% (a realistic 6-point gain). That’s $18,000 per month in recovered revenue, or $216,000 annually. Add faster deposits that free up $30,000 in working capital. Add chargeback prevention that saves $3,000 per month in lost disputes and fees. You now have a materially different cash position without acquiring a single new customer.
Decide where this recovered cash creates the most leverage. For most eCommerce businesses in the 10–50 employee range, the highest-return reinvestment targets are inventory depth (reducing stockouts on best-sellers), paid acquisition (scaling campaigns that are already profitable but budget-constrained), and fulfillment speed (faster shipping converts browsers into buyers and reduces “item not received” chargebacks).
Build a simple reinvestment model. Track recovered revenue as a separate line item in your monthly P&L. Allocate a fixed percentage (start with 50%) to growth activities and let the rest strengthen your cash reserve. Review the allocation quarterly. As your authorization rate stabilizes at a higher level, shift more of the recovered amount into growth.
Anti-patterns: Don’t treat recovered revenue as a windfall and spend it reactively. The value of this framework is predictability. Don’t reinvest 100% immediately. Cash reserves protect you from the volatility that payment issues create in the first place.
Success indicators: Recovered revenue appears as a tracked line item. You have a documented reinvestment allocation. Your growth spending is funded by payment optimization, not by additional debt or margin compression.
Practical Examples: What This Looks Like in Action
Scenario A: The Subscription Box Brand
A subscription eCommerce brand processing $150,000/month in recurring charges discovers that 12% of monthly rebills are declining. Their audit reveals 85% of those declines are soft (insufficient funds, generic bank declines). They implement a 3-step retry schedule spaced across 7 days and add a recovery email with a direct card-update link. Within 60 days, they recover 52% of previously lost rebills, adding $9,360/month in retained revenue. They reinvest half into acquiring new subscribers, accelerating growth without increasing customer acquisition cost.
Scenario B: The DTC Apparel Store
A direct-to-consumer apparel brand with an average order value of $65 notices that their authorization rate is 84%. Their processor’s fraud filters are set to flag orders where billing and shipping addresses differ, which affects nearly 30% of their gift-season orders. After reviewing risk thresholds with their account manager and enabling 3DS2 for medium-risk transactions, their authorization rate climbs to 92%. On $250,000 in monthly volume, that 8-point improvement represents $20,000 in previously blocked sales. They also switch to next-day funding, freeing up capital to pre-order inventory for their next product drop rather than waiting on a purchase order loan.
Scenario C: The Before-and-After Cash Flow Snapshot
Consider a business doing $200,000/month with an 86% authorization rate, 3-day settlement, and a 0.9% chargeback ratio. After implementing this framework: authorization rate reaches 93% (+$14,000/month), settlement drops to next-day (freeing ~$26,000 in working capital), and chargeback ratio falls to 0.4% (saving ~$2,000/month in fees and lost revenue). Total monthly impact: roughly $16,000 in recovered and retained revenue, plus $26,000 in freed working capital. That’s the difference between scraping by and investing in growth.
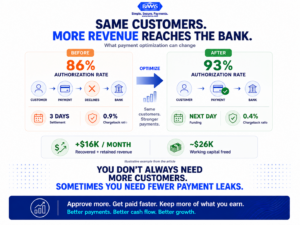
Improving payment approvals and deposit speed can strengthen cash flow without requiring the business to acquire more customers.
Common Mistakes and Pitfalls
Treating all declines the same. Hard declines and soft declines require completely different responses. Retrying a cancelled card wastes processor goodwill. Not retrying a temporary insufficient-funds decline wastes revenue.
Ignoring decline data because it “seems like a small number.” A 5% false decline rate on $300,000 monthly volume is $15,000. Over a year, that’s $180,000. It’s not small.
Over-tightening fraud rules after a single incident. One chargeback from a fraudulent order can trigger a knee-jerk response that blocks hundreds of legitimate transactions. Calibrate, don’t panic.
Optimizing approval rates but ignoring deposit speed. Recovering revenue that sits in a 3-day settlement queue doesn’t solve your cash flow problem. Both levers matter.
Never auditing again after the first fix. Customer behavior, card networks, and issuer risk models change. Schedule a quarterly review of your decline data and recovery metrics. What worked six months ago may need adjustment.
What to Do Next
Start with Step 1 this week. Pull your decline report, calculate your authorization rate, and put a dollar figure on the revenue at stake. That single number will clarify every decision that follows.
If your processor can’t provide decline reason codes in a readable format, or if you can’t get a human on the phone to discuss your risk settings, take that as useful information about whether your current partner is set up to help you grow.
You don’t need to implement all six steps at once. Diagnose first. Build your recovery workflow second. Then evaluate whether your deposit timing and chargeback defenses match the speed at which your business operates. Revisit this guide as a reference point each quarter when you review your payment metrics.
The revenue is already there. Your customers already want to pay you. The work is removing the friction between their intent and your bank account.
Frequently Asked Questions
What are payment decline signals and why should eCommerce managers track them?
Payment decline signals are the reason codes your processor returns when a transaction fails (insufficient funds, do not honor, expired card, suspected fraud, etc.). Tracking them lets you distinguish between recoverable soft declines and permanent hard declines, quantify lost revenue by category, and take targeted action. Without this data, you’re flying blind on one of the largest hidden revenue leaks in your business.
How do false declines impact customer relationships?
Most customers who experience a false decline don’t contact support. They leave your site, often permanently. Because the decline feels like a rejection from your store (not their bank), it damages trust at the moment of highest purchase intent. Over time, false declines quietly erode repeat purchase rates and lifetime customer value without appearing in any standard analytics report.
When should merchants conduct a payment processing audit?
At minimum, quarterly. Pull your decline report, calculate your authorization rate, and compare it to the 85–95% benchmark range. You should also audit after any significant change: new product launches, seasonal volume spikes, changes to your checkout flow, or switching payment gateways. If your authorization rate drops more than 2 points in any month, investigate immediately.
How can eCommerce businesses optimize payment processing to reduce declines?
Three high-impact actions: First, ensure you’re sending complete transaction data (AVS, CVV, customer email, shipping address) with every charge. Second, review your fraud filter thresholds with your processor to ensure they match your actual risk profile. Third, implement a structured retry schedule for soft declines, spacing attempts across different times and days rather than retrying immediately.
Which factors affect the speed of payment deposits?
The main factors are your processor’s settlement schedule, your batch submission cutoff time, your bank’s deposit processing window, and whether you’ve enrolled in next-day funding. Some processors hold funds for 48–72 hours as a default. Others offer next-day or same-day settlement. Batch cutoff timing also matters: transactions authorized after your cutoff roll into the next settlement cycle, adding an extra day of delay.
What’s the difference between interchange-plus pricing and tiered pricing for processing fees?
Interchange-plus pricing passes through the actual card network cost (interchange) and adds a fixed markup. It’s transparent and predictable. Tiered pricing groups transactions into “qualified,” “mid-qualified,” and “non-qualified” buckets with different rates, often obscuring the true cost. For most eCommerce businesses, interchange-plus pricing results in lower total costs and makes it easier to identify where your processing fees actually go.
Sources
- https://corporate.visa.com/en/solutions/acceptance/process-payments.html
- https://nrf.com/blog/better-way-understand-ecommerce-risk-landscape
- https://merchantriskcouncil.org/learning/resource-center/member-news/blog/2025/chargebacks-and-fraud-2025-fighting-advanced-fraud-tactics-with-equally-sophisticated-strategies