Interchange-Plus Pricing: Audit Your Statement Step by Step
How to calculate your effective processing rate, spot hidden fees, and verify Level 2/3 B2B qualification
Learn how to read your merchant processing statement line by line, calculate your true effective processing rate, and identify hidden fees inflating your B2B costs. This step-by-step audit gives you hard evidence to negotiate or switch processors.
TL;DR
- Calculate your effective processing rate first – Divide total fees by total volume. For B2B eCommerce on interchange-plus pricing, anything above 2.80% signals hidden costs or interchange downgrades worth investigating.
- Categorize every fee on your statement – Separate interchange (non-negotiable), network fees (non-negotiable), processor markup (negotiable), and ancillary fees (often eliminable). If ancillary fees exceed 0.15% of volume, you’re overpaying.
- Verify Level 2/3 qualification on B2B transactions – Look for “EIRF” or “Standard” interchange categories on commercial card transactions. These are downgrades that cost you 0.40-0.60% more per transaction than properly qualified Level 3 rates.
- Isolate your processor’s true markup – Subtract interchange and network fees from total fees. A competitive mid-market markup is 0.20-0.50% above interchange. Anything over 0.60% means you have negotiation leverage.
- Audit monthly, not annually – Cost creep happens gradually through new ancillary fees and qualification drift. A 20-minute monthly check prevents small overcharges from compounding into significant annual losses.
What You’ll Achieve: A Complete Statement Audit for Hidden B2B Processing Costs
By the end of this tutorial, you will know how to read your merchant processing statement line by line, calculate your effective processing rate, identify hidden fees in merchant services that inflate your B2B costs, and verify whether your transactions actually qualify at Level 2 or Level 3 interchange rates. Most eCommerce managers never learn this skill because processors don’t make it easy. That changes now.
Your success criteria are clear: you’ll have a documented effective rate for your B2B volume, a list of every fee category on your statement with its dollar impact, and hard evidence of whether your processor is delivering the Level 2/3 optimization they may have promised. This gives you the data to negotiate, switch, or confirm you’re already getting a fair deal.

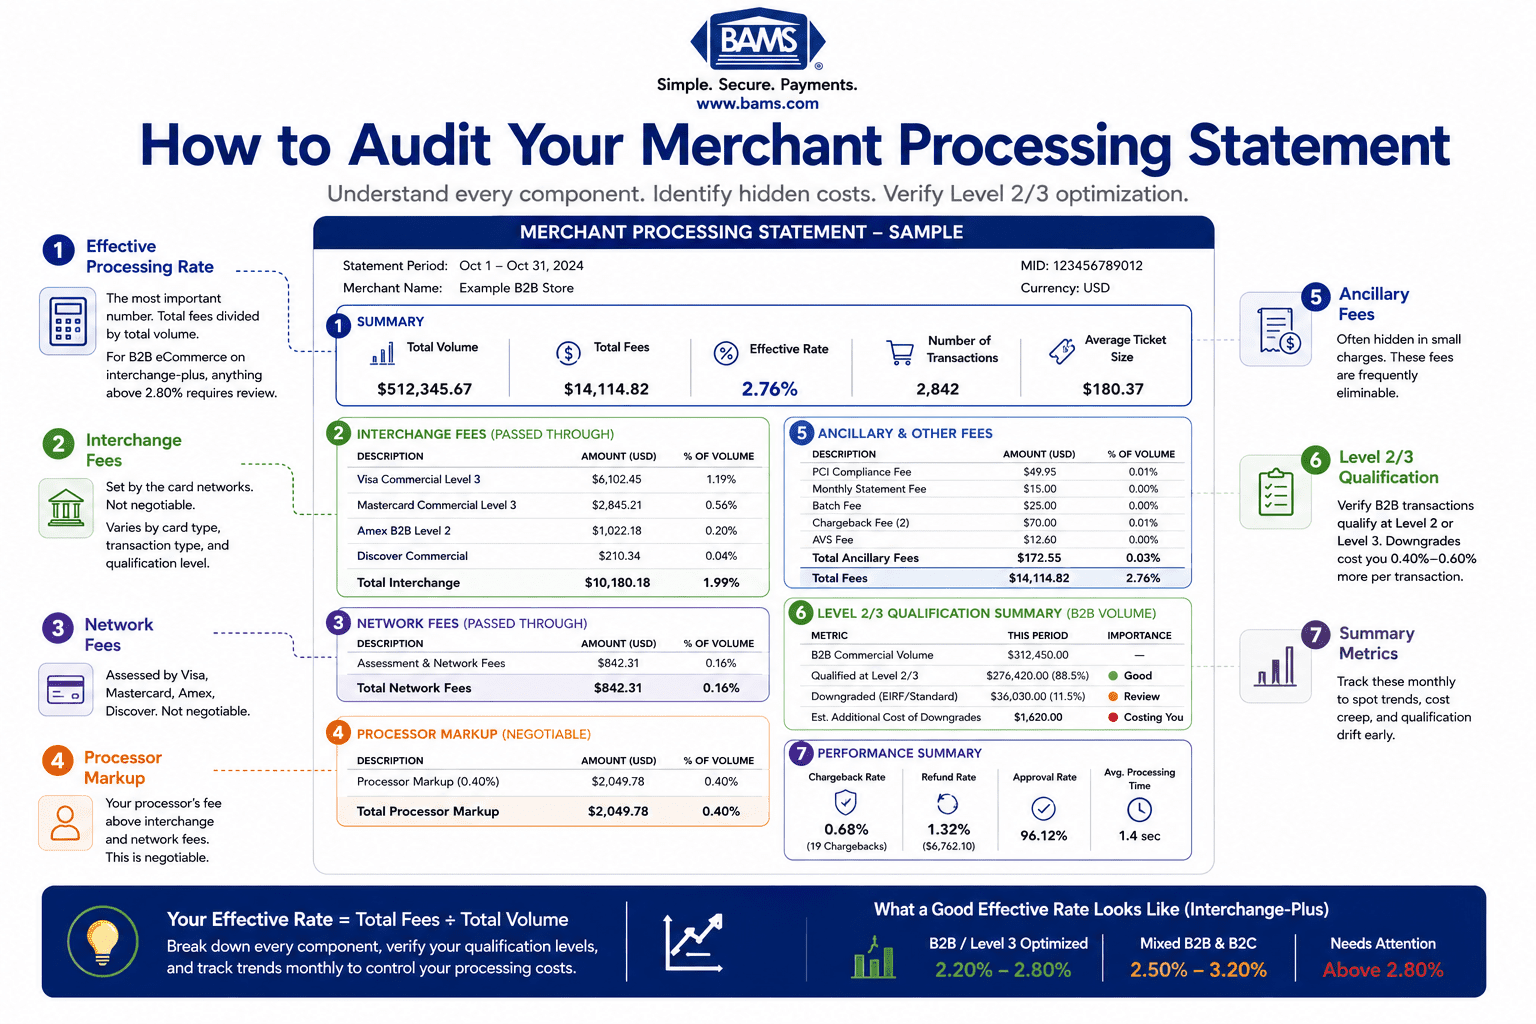
A merchant processing statement contains far more than total fees. Breaking each section into categories helps businesses identify hidden costs, processor markups, and missed interchange optimization opportunities.
Prerequisites and Setup: What You Need Before You Start
Gather these items before you begin. Missing even one will stall your audit.
- Your last 3 monthly processing statements (PDF or paper). Three months smooths out seasonal variation.
- A spreadsheet tool (Google Sheets, Excel, or similar) to track fee categories and calculate rates.
- Your processing agreement or contract, if accessible. This documents your agreed-upon markup and any rate guarantees.
- Access to your payment gateway’s transaction detail report (Shopify Payments, WooCommerce, BigCommerce, or standalone gateway). You need individual transaction records to cross-reference.
- 60-90 minutes of uninterrupted time for your first audit. Subsequent months take 20-30 minutes.
Potential blocker: Some processors combine multiple fee types into a single line labeled “discount rate” or “processing fees.” If your statement has fewer than 5 distinct line items, you may be on a bundled or tiered pricing model that obscures costs by design. This tutorial still helps you calculate your effective rate, but you’ll want to request an itemized breakdown from your processor before proceeding to Step 4.
Why Statement Auditing Beats Rate Shopping
eCommerce managers often compare advertised rates across processors, looking for the lowest number. The problem is that advertised rates rarely reflect what you actually pay. Advertised rates can be misleading because they exclude network fees, assessment fees, and dozens of ancillary charges that accumulate on your statement each month.
Interchange-plus pricing separates processing costs into three components: interchange, network assessments, and the processor’s markup. This transparency allows businesses to understand where their payment costs originate and identify opportunities for optimization. But even on interchange-plus, hidden markups and misqualified transactions quietly erode those savings. The only reliable method is to audit what you’re actually paying, not what you were quoted. Visa’s payment processing guidance explains how interchange, network fees, and processor markups combine to determine total payment acceptance costs.
This approach works for any processor and any pricing model. You don’t need to switch providers to benefit. You need data.
According to the Federal Reserve’s 2025 Small Business Credit Survey, managing operating expenses remains a priority for many businesses, making payment cost transparency increasingly valuable.
Step 1: Locate Your Statement’s Summary Section and Record Totals
Open your most recent processing statement. Find the summary section, typically on page 1 or 2. Record three numbers in your spreadsheet:
- Total processing volume (the gross dollar amount of all transactions)
- Total fees charged (the sum of all fees deducted for the month)
- Total number of transactions
Expected result: You should see a clear dollar figure for volume (e.g., $187,432.00) and a total fees figure (e.g., $5,248.10). If your statement doesn’t show a single total fees number, you’ll need to add up every fee line item manually in the next step.
Common failure: Some statements show “net deposits” instead of gross volume. Net deposits have fees already subtracted. If you only see net deposits, add total fees back to get gross volume: Net Deposits + Total Fees = Gross Volume.
Step 2: Calculate Your Effective Processing Rate
This is the single most important number in your payment operations. Your effective processing rate tells you what you actually pay per dollar processed, across all card types, all fee categories, everything included.
The formula is simple:
Effective Rate = (Total Fees / Total Processing Volume) × 100
Example: $5,248.10 in fees ÷ $187,432.00 in volume × 100 = 2.80%
Record this number. Now do the same calculation for your previous two months. You’re looking for consistency and trends.
Checkpoint: For B2B eCommerce on interchange-plus pricing, a healthy effective rate typically falls between 2.10% and 2.60%, depending on your card mix and average ticket size. If your rate exceeds 2.80%, there are almost certainly hidden fees inflating your costs. If it exceeds 3.00%, you likely have significant interchange downgrade issues or excessive ancillary fees (or both).
Common failure: Your rate fluctuates more than 0.15% between months without a corresponding change in card mix. This signals rate drift, which we’ll diagnose in Step 5.
Step 3: Break Down Every Fee Category on Your Statement
Now go line by line through your statement. Create a spreadsheet with four columns: Fee Name, Amount, Category, and Notes. Categorize each fee into one of these buckets:
- Interchange fees (paid to the card-issuing bank). These are non-negotiable and set by Visa/Mastercard. According to Federal Reserve data, interchange fees across all debit and prepaid card transactions totaled $34.12 billion in 2023.
- Network/assessment fees (paid to Visa, Mastercard, Discover, or Amex). Also non-negotiable. The average network fee per transaction rose to $0.129 in 2023.
- Processor markup (your processor’s profit margin). This is the only negotiable component.
- Ancillary fees (PCI compliance fees, batch fees, statement fees, gateway fees, monthly minimums, etc.). These are where hidden costs live.
Visa’s payment processing guidance explains the role of interchange, network assessments, and processor services in the overall payment acceptance process.
Expected result: You should have 8-25 distinct line items. If you have fewer than 5, your statement is bundled and you need to request itemization.
Common failure: You can’t tell which fees are interchange and which are markup. On a true interchange-plus statement, interchange is listed separately (often as “IC” or “Interchange” with specific rate categories like “EIRF” or “Data Rate I”). If everything is lumped under “Qualified,” “Mid-Qualified,” and “Non-Qualified,” you’re on tiered pricing, which is inherently less transparent.
Step 4: Identify the Ancillary Fees That Don’t Belong
With your fee categories mapped, focus on the ancillary fees column. These are the charges most likely to be inflated, duplicated, or entirely unnecessary. Watch for these specific culprits:
- PCI non-compliance fee ($19.95-$99.95/month). If you’ve completed your PCI SAQ and you’re still being charged, this is pure margin for your processor.
- Batch fee ($0.10-$0.30 per batch). Legitimate, but some processors charge per batch AND per transaction settlement, doubling up.
- Statement fee ($5-$15/month). Paying for a PDF your processor generates automatically costs you nothing to produce.
- Regulatory compliance fee / “network access fee” ($25-$99/month). These vaguely named fees often have no corresponding charge from Visa or Mastercard. They’re processor-invented margin.
- Annual fee or account maintenance fee ($79-$299/year). Check your contract. If it’s not in your original agreement, it was added later.
For a deeper breakdown of each fee type and its typical dollar impact, see this guide on 7 hidden fees draining B2B margins.
Checkpoint: Add up all ancillary fees. Divide by your total volume. If ancillary fees alone account for more than 0.15% of your effective rate, you have room to negotiate or eliminate charges.
Step 5: Check for Interchange Downgrades on B2B Transactions
This is where most B2B eCommerce businesses lose the most money without realizing it. Interchange downgrades happen when a transaction doesn’t include enough data to qualify for the lowest available interchange rate. Instead of getting the optimized B2B rate, your transaction gets reclassified to a higher, more expensive category.
On your statement, look for interchange categories containing these terms:
- “EIRF” (Electronic Interchange Reimbursement Fee) — This is a downgrade. It means the transaction failed to qualify at its optimal level.
- “Standard” — Another downgrade indicator. Standard rates are the most expensive interchange tier.
- “Data Rate I,” “Data Rate II,” or “Data Rate III” — These indicate Level 1, Level 2, or Level 3 qualification. You want to see Data Rate II or III for B2B transactions.
The cost difference is significant. A B2B credit card transaction qualifying at Level 3 can cost 0.40-0.60% less in interchange than the same transaction at Level 1. On $50,000 in monthly B2B volume, that’s $200-$300/month in unnecessary fees.
Action: Count the number of transactions at EIRF or Standard rates. If more than 5% of your B2B transactions land in these categories, your gateway or processor is not passing the required data fields (tax amount, customer code, line-item detail) to qualify at Level 2 or Level 3.
Step 6: Verify Level 2/3 Data Is Actually Being Passed
Many processors claim to support Level 2/3 optimization, but claiming and delivering are different things. Your statement is the proof. Here’s how to verify:
On your statement: Look for a section that breaks interchange into qualification levels. If your B2B transactions consistently show “Commercial Card” or “Purchasing Card” categories at Data Rate II or III, your processor is passing the enhanced data. If those same cards show up at EIRF or Standard, they’re not. The Visa Commercial Enhanced Data Program (CEDP) describes how enhanced transaction data helps eligible commercial card transactions qualify for more favorable interchange categories.
In your gateway: Pull a transaction detail report for a known B2B order. Check whether these fields were transmitted:
- Level 2: Tax amount, customer/PO number, merchant postal code
- Level 3: All Level 2 fields plus line-item detail (product description, quantity, unit cost, commodity code)
If your gateway doesn’t show these fields in the transaction record, the data isn’t being sent, regardless of what your processor told you during onboarding. For more on spotting this specific issue, review these 5 signals your statement is leaking B2B margins.
Common failure: Your eCommerce platform collects tax and PO information, but your payment gateway doesn’t map those fields to the processor’s Level 2/3 data submission. The data exists in your system but never reaches the card networks.
Step 7: Calculate Your Processor’s True Markup
Now that you’ve separated interchange, network fees, and ancillary charges, you can isolate what your processor actually earns on your account. This is your true processor markup.
Processor Markup = Total Fees – Interchange Fees – Network/Assessment Fees
Markup Rate = (Processor Markup / Total Volume) × 100
Example: $5,248.10 total fees – $3,561.00 interchange – $412.50 network fees = $1,274.60 processor markup. $1,274.60 ÷ $187,432.00 × 100 = 0.68% processor markup.
On interchange-plus pricing, your processor’s quoted markup might be something like 0.25% + $0.10 per transaction. But when you add in all the ancillary fees, the true markup is almost always higher. Calculating the processor’s true markup provides a clearer view of the portion of payment costs that can actually be negotiated.
Checkpoint: A competitive processor markup for mid-market eCommerce (processing $100K-$500K/month) typically ranges from 0.20% to 0.50% above interchange. If your calculated markup exceeds 0.60%, you’re overpaying on the negotiable portion of your fees.
Step 8: Build Your Negotiation Brief
You now have everything you need to have a data-driven conversation with your processor (or to evaluate alternatives). Compile these findings into a one-page brief:
- Your effective rate (3-month average)
- Your true processor markup (isolated from interchange and network fees)
- Total ancillary fees per month and which ones you want eliminated
- Downgrade percentage (what share of B2B transactions failed Level 2/3 qualification)
- Estimated monthly savings if downgrades were corrected and unnecessary fees removed
This brief transforms your negotiation from “I think I’m paying too much” to “Here’s exactly where I’m overpaying and by how much.” Processors respond differently when you demonstrate this level of statement literacy.
If your current processor can’t resolve the downgrade issue or justify the ancillary fees, providers like BAMS specialize in transparent interchange-plus pricing with dedicated account management that can walk through your audit findings and identify specific savings. Their focus on mid-market eCommerce means they’re built for exactly this kind of cost analysis.
Configuration and Customization: Adjusting for Your Business
Following a structured monthly audit process helps businesses identify hidden processing costs, validate interchange qualification, and negotiate with processors using real transaction data instead of estimates.
Your audit parameters should reflect your specific business profile. Here are the key variables to adjust:
- B2B vs. B2C split: If only 30% of your volume is B2B, focus your Level 2/3 analysis on that segment only. Calculate a separate effective rate for B2B transactions to see the true cost difference.
- Average ticket size: Per-transaction fees ($0.10-$0.30 each) matter more when your average order is $25 than when it’s $2,500. Weight your analysis accordingly.
- Card mix: High Amex volume naturally raises your effective rate because Amex interchange is higher. Separate Amex from Visa/Mastercard in your analysis to avoid misleading conclusions.
- Seasonal volume swings: If your Q4 volume is 3x your Q1 volume, your per-transaction ancillary fees will have a smaller percentage impact in peak months. Use a 12-month average for the most accurate picture.
Safe defaults: Start with a 3-month analysis window, all card types combined, total volume. Only segment further if your initial effective rate looks anomalous or if B2B represents more than 20% of your volume.
Verification and Testing: Confirming Your Audit Is Accurate
Before you act on your findings, verify them. Cross-check your statement totals against your bank deposits. Your gross processing volume minus total fees should equal the sum of all deposits from your processor during that statement period (plus or minus timing differences for month-end batches).
Test procedure: Pick 5 individual B2B transactions from your gateway. Find each one on your statement. Confirm the interchange category assigned matches what you’d expect for that card type and data level. If a corporate Visa purchasing card shows up at EIRF instead of Data Rate III, that’s a confirmed downgrade you can point to specifically.
Edge cases to verify: Check refunded transactions (you should receive an interchange credit), international cards (which carry higher interchange and cross-border fees), and any transactions flagged as “card not present” surcharges.
Common Errors and Fixes During Your Statement Audit
“My statement doesn’t show interchange categories at all.”
Cause: You’re on tiered or flat-rate pricing, not interchange-plus. Fix: Request an interchange-plus statement from your processor, or ask for a “passthrough detail” report. If they can’t provide one, this itself is a red flag about cost transparency.
“My effective rate changes by 0.30%+ between months with similar volume.”
Cause: Likely interchange downgrades fluctuating based on data quality, or Visa/Mastercard’s semi-annual rate adjustments (typically April and October). Fix: Compare the months’ interchange category breakdowns side by side. The category that grew is your culprit.
“I see Level 2/3 fees on my statement but my transactions still downgrade.”
Cause: Some processors charge a “Level 2/3 processing fee” ($0.03-$0.05 per transaction) without actually submitting the enhanced data. You’re paying for optimization that isn’t happening. Fix: Request a qualification report showing the actual interchange category each transaction received.
“My processor says my rate is 2.20% but my effective rate is 2.85%.”
Cause: The quoted 2.20% is likely just the interchange-plus markup on qualified transactions. It excludes non-qualified surcharges, network fees, and all ancillary fees. Fix: This is exactly why effective rate is the only honest metric. Use your calculated number, not their quoted one.
“I found issues but my contract has an early termination fee.”
Cause: Many processing agreements include ETFs of $295-$595 or liquidated damages clauses. Fix: Calculate your annual overpayment from the issues you found. If it exceeds the ETF, switching still saves money. Also check if your ETF is waivable; BAMS and other transparent providers sometimes cover termination fees for qualifying merchants.
Next Steps: What to Do After Your First Audit
You’ve completed the hard part. Here’s how to build on it:
- Set a monthly audit calendar. Spend 20 minutes each month recalculating your effective rate and checking for new ancillary fees. Cost creep happens gradually.
- Automate Level 2/3 data submission. Work with your eCommerce platform and gateway to ensure tax amounts, PO numbers, and line-item details are mapped correctly for every B2B order.
- Benchmark against industry rates. Now that you know your true costs, compare your processor markup (not your effective rate) against competitive quotes. This apples-to-apples comparison prevents the bait-and-switch of low quoted rates with high ancillary fees.
Your processing statement is not just an invoice. It’s a diagnostic tool. The eCommerce managers who read it as one consistently pay less than those who don’t.
Frequently Asked Questions
What is interchange-plus pricing and how does it work?
Interchange-plus pricing separates your processing fees into three visible components: the interchange fee (set by the card-issuing bank), the network/assessment fee (set by Visa or Mastercard), and the processor’s markup (the only negotiable part). This transparency lets you see exactly what you pay per transaction and identify where costs can be reduced. It’s generally more cost-effective than tiered or flat-rate pricing for businesses processing significant volume.
Why should B2B businesses care about Level 2/3 data optimization?
Level 2 and Level 3 data optimization reduces the interchange rate on commercial, corporate, and purchasing card transactions by providing additional transaction details (tax amount, PO number, line-item data) to the card networks. B2B transactions that qualify at Level 3 can cost 0.40-0.60% less in interchange than the same transaction at Level 1. For a business processing $50,000/month in B2B card volume, that translates to $200-$300/month in savings.
How do I calculate my effective processing rate?
Divide your total monthly processing fees by your total monthly processing volume, then multiply by 100. For example, $5,248 in fees divided by $187,432 in volume equals a 2.80% effective rate. This number includes every fee on your statement and is the only accurate measure of what you actually pay to accept cards.
What are the most common hidden fees in merchant services?
The most frequent hidden fees include PCI non-compliance charges ($19.95-$99.95/month even when you’re compliant), vaguely named “regulatory” or “network access” fees ($25-$99/month), duplicate batch and settlement fees, annual account maintenance fees not in your original contract, and statement fees for digital documents. These ancillary charges can add 0.15% or more to your effective rate without providing any corresponding value.
When is the best time to negotiate processing fees with my provider?
The best time is immediately after completing a statement audit with documented findings. Processors are most responsive when you can point to specific line items, your calculated effective rate, and your true processor markup. Seasonally, avoid negotiating right before your peak sales period when switching risk is highest. Also be aware that Visa and Mastercard adjust interchange rates in April and October, so auditing shortly after those dates gives you the most current baseline.
How can I tell if my processor is actually submitting Level 2/3 data?
Check your processing statement for interchange category labels. B2B transactions qualifying at Level 2 or 3 will show categories like “Data Rate II” or “Data Rate III.” If your commercial card transactions appear at “EIRF” or “Standard” rates, the enhanced data is not being submitted, regardless of what your processor claims. You can also check your gateway’s transaction detail report to see whether tax amount, customer code, and line-item fields were transmitted.


