How to Choose a Payment Processor for Faster Deposits
Last Updated on July 29, 2026 by Dimitri Akhrin
Reduce chargebacks, unlock next-day funding, and turn processor selection into a cash flow advantage
Learn how your payment processor directly controls settlement speed and chargeback costs. This guide gives eCommerce managers a step-by-step system for reducing disputes, qualifying for better funding terms, and converting those gains into faster deposits.
TL;DR
- Chargebacks affect more than revenue – Your dispute ratio directly determines your settlement speed, interchange rates, and whether your processor holds reserves against your deposits.
- Prevention compounds, response doesn’t – Stopping disputes before they happen lowers your risk profile, which unlocks faster funding and better rates. Winning representment battles recovers individual transactions but doesn’t improve your terms.
- Settlement speed is negotiable – Your payment processor decides when you get paid based on your risk profile. A dispute ratio below 0.5% puts you in a strong position to qualify for next-day funding.
- Start with an audit – Pull 6 months of chargeback data, categorize by reason code, and calculate your all-in cost per dispute. This tells you exactly where to focus prevention efforts for the biggest financial impact.
- Treat this as an operating discipline – Monthly monitoring, quarterly filter adjustments, and annual processor reviews keep your gains intact and create a flywheel of improving cash flow over time.
Guide Orientation: What This Covers and Who It’s For
This guide shows eCommerce managers how to turn chargeback reduction into measurable financial gains, specifically faster deposits and lower processing costs. If you manage payments for an established online business and feel like chargebacks are an unavoidable cost of doing business, this is for you.
By the end, you’ll understand how your payment processor determines not just chargeback outcomes but also settlement speed, and how the two are directly connected. You’ll walk away with a step-by-step system for reducing disputes, qualifying for better funding terms, and converting those improvements into real cash flow gains.
This guide does not cover basic chargeback definitions or how to file a single dispute response. It assumes you already accept digital payments and have experienced chargebacks. The focus is on systemic improvements that compound over time.
Why Turning Fewer Chargebacks Into Real Savings Matters Now
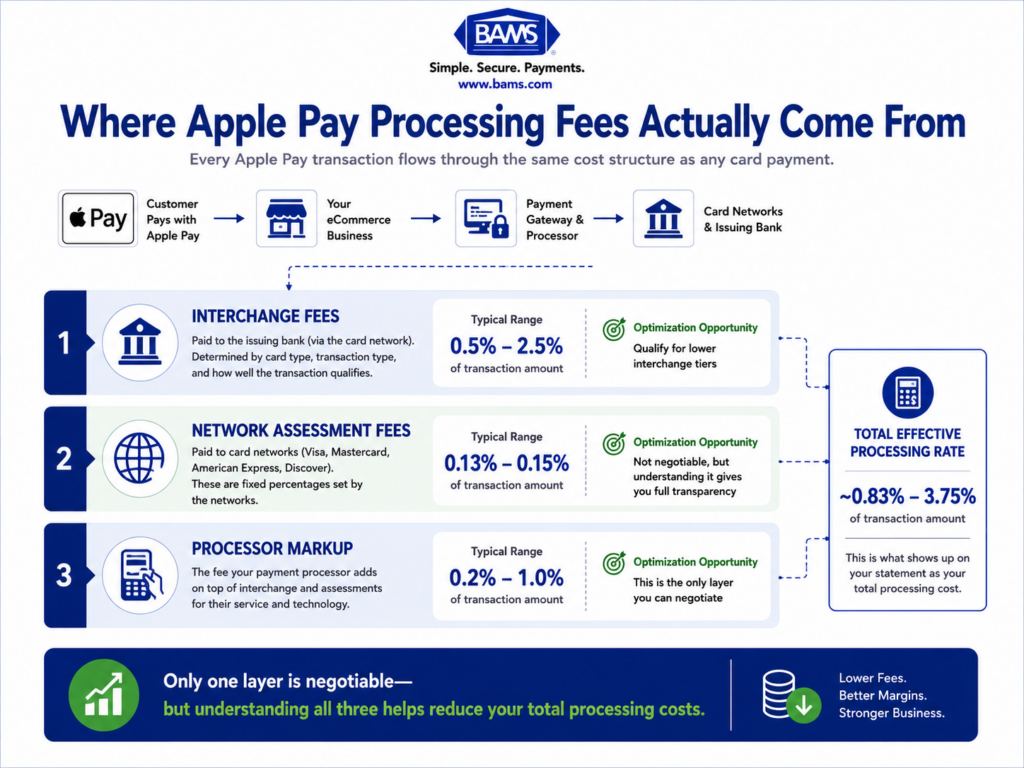
Digital wallets have become a mainstream payment method for both eCommerce and in-store purchases. As more customers choose Apple Pay, Google Pay, and similar payment methods, merchants need dispute processes that reflect how tokenized transactions differ from traditional card payments.
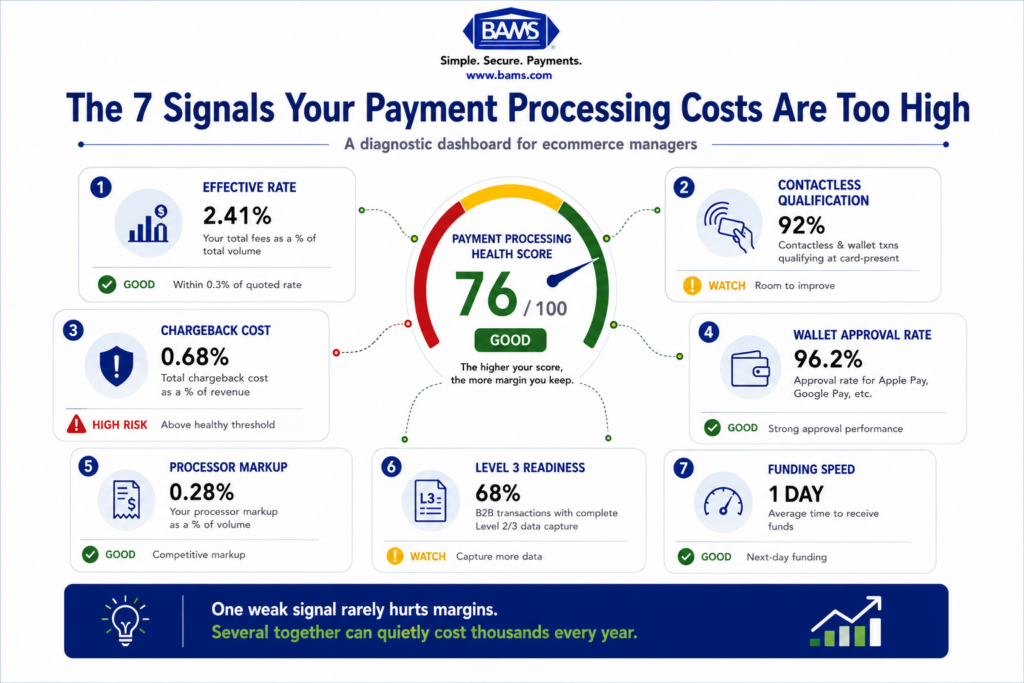
Every chargeback carries direct fees (typically $20 to $100 per dispute), but the hidden costs are larger. Processors monitor your dispute ratio. When it climbs above 0.65% to 1%, you risk being placed in monitoring programs with higher per-transaction fees, delayed settlement windows, or outright account termination. The cost of inaction is not just the chargebacks you’re paying today; it’s the slower deposits and inflated rates you’re absorbing tomorrow.
Meanwhile, the share of payments settled within one business day has increased by 11.6 percentage points to 82.2% globally. Faster settlement is becoming the norm, but processors gate access to it based on your risk profile. Your chargeback ratio is one of the primary inputs to that calculation. Reducing disputes doesn’t just save you money on fees; it unlocks faster access to every dollar you earn.
Core Concepts: The Chargeback-to-Cash-Flow Connection
Chargebacks Are a Risk Signal, Not Just a Cost
Most eCommerce managers think of chargebacks as individual problems: a customer disputes a charge, you lose the revenue plus a fee. But processors see chargebacks as a pattern. Your dispute ratio (chargebacks divided by total transactions) is a risk metric that directly influences your processing terms, including interchange qualification, reserve requirements, and settlement timing.
Settlement Speed Is a Processor-Level Decision
Many merchants assume deposit timing is fixed by the payment method or card network. It’s not. Your processor decides when to release funds based on your risk profile. A merchant with a 0.3% dispute ratio and consistent transaction patterns will often qualify for next-day funding. A merchant with a 0.9% ratio processing the same volume may wait two to three business days, or face rolling reserves that hold back 5% to 10% of deposits for months.
The Compounding Effect
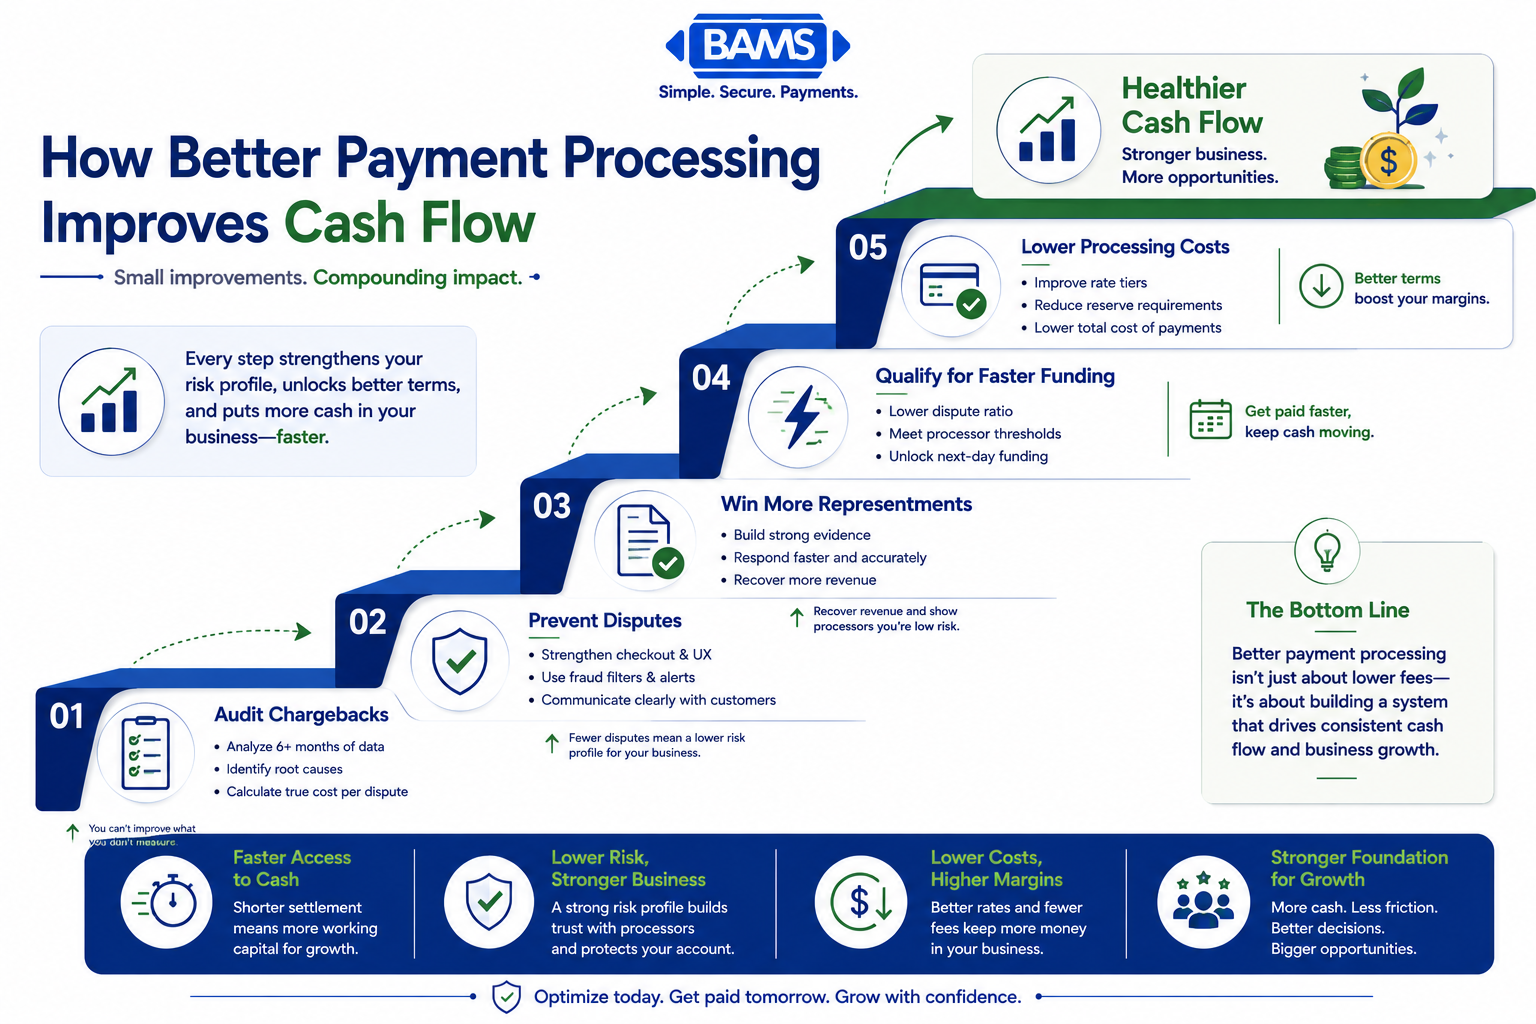
Here’s the concept that ties this guide together: chargeback reduction compounds. Fewer disputes lower your risk score. A lower risk score qualifies you for faster settlement and better interchange rates. Faster settlement improves cash flow. Better cash flow means you can invest in fulfillment, customer service, and fraud tools that further reduce chargebacks. This is a flywheel, not a one-time fix.
Key Distinction: Prevention vs. Response
Responding to chargebacks (representment) recovers revenue after a dispute. Prevention stops the dispute from happening. Both matter, but prevention delivers the compounding benefits described above. Response is damage control. This guide prioritizes prevention while covering both.
The Framework: Four Stages of Chargeback-to-Savings Conversion
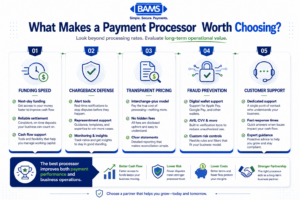
Choosing a payment processor isn’t only about transaction fees. Funding speed, dispute support, fraud prevention, and long-term operational value all contribute to better cash flow.
This guide follows a four-stage process that moves from diagnosis through optimization. Each stage builds on the previous one.
- Stage 1: Audit — Understand where your chargebacks originate, what they cost, and how they affect your processor relationship.
- Stage 2: Prevent — Implement systematic changes to your checkout, fulfillment, and communication workflows that stop disputes before they start.
- Stage 3: Defend — Build a response system for the disputes that do occur, maximizing win rates and minimizing processing time.
- Stage 4: Optimize — Use your improved dispute profile to negotiate better settlement terms, lower rates, and faster funding.
These stages are sequential for first-time implementation but cyclical for ongoing management. You’ll revisit the audit phase quarterly to catch new patterns.
Step-by-Step Breakdown: From Chargebacks to Real Savings
Step 1: Audit Your Chargeback Landscape
Objective: Build a complete picture of your dispute sources, costs, and processor-level consequences within 5 business days.
Start by pulling your chargeback data for the last 6 to 12 months. Categorize each dispute by reason code, product category, sales channel, and customer acquisition source. You’re looking for clusters, not individual incidents. Common patterns include: a specific product generating disproportionate disputes, a marketing channel driving buyers who dispute at higher rates, or a fulfillment delay window that correlates with “item not received” claims.
Calculate your true chargeback cost per dispute. Add the transaction amount, the chargeback fee, the cost of staff time spent on response, and any inventory loss. For most eCommerce businesses in the 10 to 50 employee range, the all-in cost per chargeback runs $150 to $350 when you include labor and lost product.
Then check your current dispute ratio against your processor’s thresholds. Visa’s Dispute Monitoring Program triggers at 0.65% (with 75 disputes in a month). Mastercard’s Excessive Chargeback Program triggers at 1.5%. Ask your processor directly where you stand and what funding terms you currently qualify for.
Anti-patterns: Don’t average your dispute ratio across all months. A single spike month can trigger monitoring even if your annual average looks healthy. Don’t ignore “friendly fraud” (legitimate purchases disputed by the cardholder). It often accounts for 40% to 70% of eCommerce chargebacks and requires different prevention tactics than true fraud.
Success indicators: You have a spreadsheet or dashboard showing dispute clusters by reason code, a calculated all-in cost per chargeback, and a documented current dispute ratio with processor threshold distances.
Step 2: Implement Pre-Dispute Prevention Systems
Objective: Reduce dispute volume by 30% to 50% within 60 days through checkout, communication, and fulfillment changes.
Prevention works at three layers. First, checkout clarity. Your billing descriptor (the name that appears on the customer’s bank statement) should match your brand name exactly. Unrecognizable descriptors are the single largest driver of “I don’t recognize this charge” disputes. Contact your processor to update it if needed. Add order confirmation screens that display the exact descriptor customers will see.
Second, proactive communication. Send shipping confirmation with tracking immediately. For digital products, send delivery confirmation with download links and a clear refund policy link. For subscription businesses, send renewal reminders 5 to 7 days before charging. Each of these touchpoints gives customers a reason to contact you instead of their bank.
Third, fraud filtering at the transaction level. Enable AVS (Address Verification Service) and CVV matching. Set velocity filters to flag multiple orders from the same IP or card within short windows. For faster checkout methods like Apple Pay, the built-in tokenization and biometric authentication already reduce fraud significantly. Some merchants report 5 to 10% faster payment processing when customers use wallets instead of manual card entry, and the tokenized transactions also carry lower fraud risk.
Anti-patterns: Don’t set fraud filters so aggressively that you decline legitimate orders. False declines cost eCommerce businesses more than actual fraud in most cases. Don’t assume that adding a “contact us” link to your website is sufficient; it needs to be in the transactional email, not buried on a help page.
Success indicators: Billing descriptor matches brand name. Automated emails fire at purchase, shipment, and delivery. Fraud filters are active but calibrated (decline rate below 3%). You have a documented chargeback prevention workflow that your team follows.
Step 3: Build a Dispute Response System That Wins
Objective: Achieve a 40%+ representment win rate on disputes that do occur, recovering revenue and demonstrating active management to your processor.
Not every chargeback is preventable. For the ones that come through, your response system determines whether you recover the revenue. Start by subscribing to chargeback alerts through your processor or a third-party alert service (Ethoca, Verifi CDRN). These give you a 24 to 72 hour window to issue a refund before the dispute formally posts, which avoids the chargeback fee and keeps your ratio clean.
For disputes that proceed to representment, build evidence templates organized by reason code. “Item not received” disputes need tracking confirmation with delivery proof. “Not as described” disputes need product listing screenshots, terms of service, and any customer communication. “Unauthorized transaction” disputes need AVS/CVV match records, device fingerprinting data, and IP geolocation.
Assign a specific team member or role to manage dispute responses. Representment has strict deadlines (typically 7 to 30 days depending on the network), and missed deadlines mean automatic losses. A structured chargeback management system ensures nothing falls through the cracks.
Anti-patterns: Don’t fight every chargeback. If the dispute amount is under $25 and the evidence is thin, the labor cost of representment exceeds the recovery. Don’t use generic response templates without customizing evidence to the specific transaction. Card networks reject boilerplate responses at high rates.
Success indicators: Alert service is active and monitored daily. Evidence templates exist for your top 5 reason codes. Response time averages under 48 hours. Win rate is tracked monthly and trends upward.
Step 4: Connect Dispute Reduction to Settlement Speed
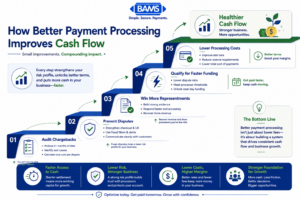
Better payment processing creates incremental improvements that compound into stronger cash flow and healthier business operations.
Objective: Use your improved dispute profile to qualify for next-day funding and reduce per-transaction costs.
This is where chargeback reduction converts into real, measurable savings. Once your dispute ratio drops below 0.5%, you’re in a strong position to renegotiate settlement terms with your processor. The share of payments settled within one hour has increased by 14.2 percentage points to 35.3% globally, which means the infrastructure for faster settlement exists. The question is whether your processor offers it and whether your risk profile qualifies you.
Contact your processor and present your dispute ratio trend (showing improvement over 3 to 6 months), your transaction volume, and your average ticket size. Ask specifically about next-day funding eligibility, interchange optimization (particularly for digital wallet transactions that may qualify for lower card-not-present rates), and any reserve reductions.
For context, the U.S. Faster Payments Council has documented how real-time payment infrastructure (RTP Network, FedNow) is enabling 24/7 settlement. Processors that leverage these rails can offer same-day or next-day funding as a standard feature rather than a premium add-on. If your current processor treats faster settlement as an upgrade with additional fees, that’s a signal to evaluate alternatives.
BAMS offers next-day funding as a core feature paired with proactive chargeback defense, which means the dispute reduction work you’ve done in Steps 1 through 3 directly translates into faster access to your revenue without paying a premium for the privilege.
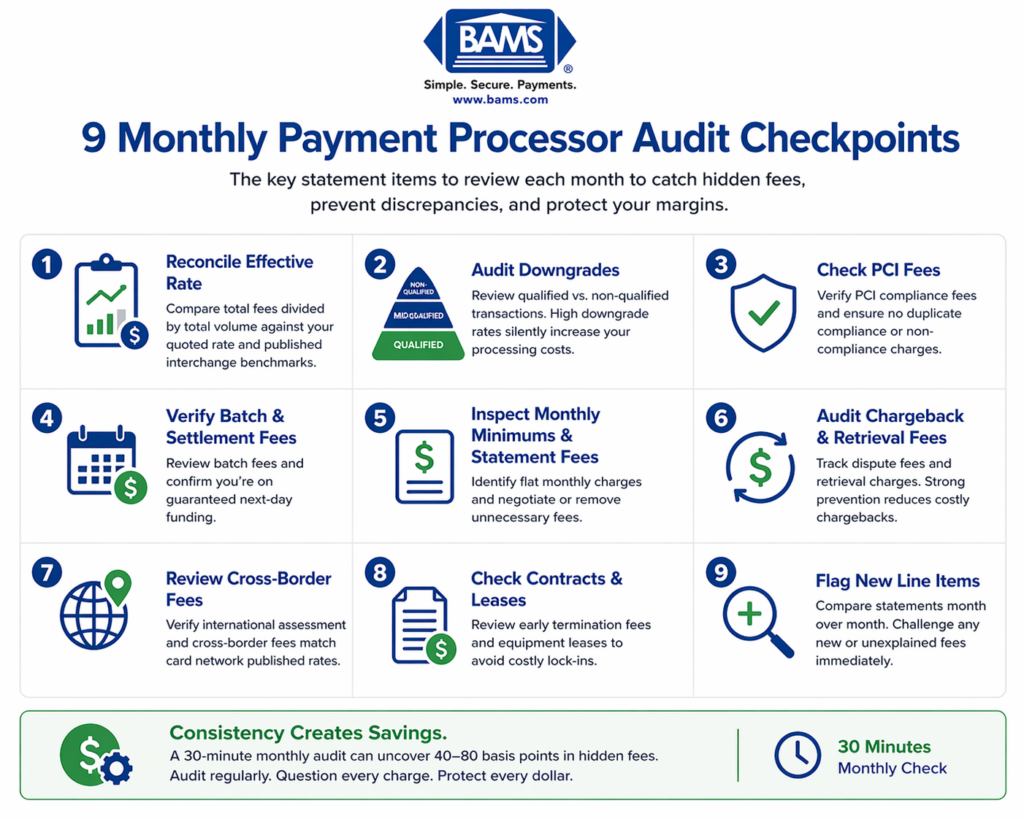
Anti-patterns: Don’t assume your current processor will proactively offer better terms. You need to ask. Don’t evaluate settlement speed in isolation; factor in per-transaction fees, monthly minimums, and contract terms. A processor offering next-day funding at 3.2% per transaction may cost more than one offering two-day funding at 2.4%.
Success indicators: You have a documented conversation (or written quote) from your processor about settlement terms tied to your dispute ratio. You’ve calculated the cash flow impact of moving from current settlement timing to next-day funding. You have a comparison of total processing costs across at least two providers.
Step 5: Monitor, Iterate, and Protect Your Gains
Objective: Maintain your improved dispute ratio and settlement terms through ongoing monitoring and quarterly optimization.
Chargeback reduction is not a project with an end date. Customer behavior shifts, fraud tactics evolve, and product mix changes can all push your dispute ratio back up. Build a monthly review cadence that tracks dispute ratio, win rate, alert-to-refund conversion rate, and settlement timing.
Set threshold alerts at 75% of your processor’s monitoring program trigger. If Visa triggers at 0.65%, set your internal alert at 0.49%. This gives you a buffer to investigate and respond before consequences kick in. Review your fraud filters quarterly and adjust thresholds based on actual decline and dispute data, not assumptions.
As global cashless payment volumes increase by more than 80% from 2020 levels, your transaction volume will likely grow too. Higher volume at the same dispute ratio means more total disputes, so your prevention systems need to scale with your business. Automate what you can (alert monitoring, evidence collection, refund workflows) and reserve human judgment for edge cases and representment decisions.
Revisit your merchant services relationship annually. Your improved metrics are leverage. Use them to negotiate better rates, confirm your funding speed, and ensure your processor’s capabilities still match your business needs.
Anti-patterns: Don’t set up monitoring and then ignore it. The most common failure mode is building a good system, seeing results, and then letting attention drift until a spike catches you off guard. Don’t treat your processor relationship as static; your business changes, and your processing terms should reflect that.
Success indicators: Monthly dashboard is reviewed by a named team member. Dispute ratio stays below 0.5% consistently. Settlement timing matches or exceeds your negotiated terms. Annual processor review is scheduled and completed.
Practical Examples: What This Looks Like in Action
Scenario A: Subscription eCommerce Brand
A supplements company processing 8,000 transactions per month had a 0.82% dispute ratio, mostly from “recurring charge not authorized” claims. They were on a two-day settlement cycle with a 5% rolling reserve. After implementing renewal reminder emails (7 days before charge), updating their billing descriptor from a parent company name to their consumer brand, and adding a one-click cancellation link, their dispute ratio dropped to 0.38% within 90 days. They used that improvement to negotiate next-day funding and eliminate the rolling reserve, freeing up roughly $14,000 in previously held funds.
Scenario B: Multi-Channel Retailer
A home goods retailer selling through their own site and two marketplaces had a blended dispute ratio of 0.71%. Their audit revealed that 60% of disputes came from one marketplace where they couldn’t control the billing descriptor or shipping communication. They shifted marketing spend toward their direct channel (where they had full control), implemented delivery photo confirmation, and built representment templates for the marketplace disputes they couldn’t prevent. Within 6 months, their direct channel dispute ratio was 0.29%, and they moved their direct-channel processing to a provider offering next-day funding tied to that lower ratio. The marketplace channel remained on slower settlement, but the overall cash flow impact was a net positive of roughly $3,200 per month in accelerated access to funds.
Scenario C: Digital Products Business
An online education platform processing $180,000 monthly had high “item not as described” dispute rates. They added a 15-minute preview window with clear refund terms, implemented post-purchase satisfaction check emails at 24 and 72 hours, and subscribed to Ethoca alerts to catch disputes before they posted. Their chargeback rate fell from 0.91% to 0.34%. The reduced rate, combined with the tokenized transactions from Apple Pay and Google Pay users (which carried lower interchange qualification), saved them roughly $1,800 per month in combined chargeback fees and interchange costs.
Common Mistakes and Pitfalls
Treating chargebacks as a customer service problem only. Customer service can resolve complaints, but it can’t fix a missing billing descriptor, a broken fraud filter, or a processor that holds your funds for three days. Chargebacks are a systems problem that requires operational changes.
Optimizing for win rate instead of prevention rate. A 60% representment win rate sounds impressive, but it means you’re still absorbing the labor cost and ratio impact of every dispute filed. Prevention at a 50% reduction rate delivers more financial value than response at a 60% win rate in almost every scenario.
Ignoring the processor’s role in settlement timing. Around 62% of large firms in the U.S. now use instant or faster payment rails, up from 47% the year before. If your processor isn’t offering competitive settlement speeds, the infrastructure exists elsewhere. Your dispute ratio is your ticket to accessing it.
Making changes without measuring baselines. If you don’t know your current all-in cost per chargeback and your current settlement timing, you can’t quantify the impact of improvements. Measure before you change.
What to Do Next
Start with Step 1. Pull your chargeback data for the last 6 months and categorize it by reason code. This single action will tell you whether your primary problem is fraud, fulfillment, communication, or friendly fraud, and it determines which prevention tactics will deliver the fastest results.
If your audit reveals that your dispute ratio is already below 0.5% and you’re still on two-day or three-day settlement, skip to Step 4 and have a direct conversation with your processor about funding speed. You may already qualify for better terms without knowing it.
Revisit this guide as a reference, not a one-time read. The chargeback-to-savings flywheel works best when you treat it as an ongoing operating discipline rather than a quarterly project. Small, consistent improvements in dispute prevention translate into meaningful, compounding financial gains over 6 to 12 months.
Frequently Asked Questions
What fees do merchants actually pay on chargebacks beyond the refund?
Beyond the refunded transaction amount, you typically pay a chargeback fee of $20 to $100 per dispute (depending on your processor and card network). Add the cost of staff time spent gathering evidence and filing responses, potential inventory loss if the product isn’t returned, and the indirect cost of a higher dispute ratio pushing you into monitoring programs with elevated per-transaction rates. The all-in cost for most eCommerce businesses runs $150 to $350 per chargeback.
How does my chargeback ratio affect deposit timing?
Processors use your dispute ratio as a primary risk signal when determining settlement speed. A ratio below 0.5% typically qualifies you for next-day funding with many processors. Ratios above 0.65% to 1% can trigger monitoring programs that slow settlement to two to three business days and may impose rolling reserves that hold back a percentage of your deposits for 90 to 180 days.
Does Apple Pay reduce chargebacks compared to traditional card payments?
Yes, in most cases. Apple Pay uses tokenization (replacing actual card numbers with device-specific tokens) and biometric authentication (Face ID or Touch ID), which significantly reduces unauthorized transaction fraud. This means fewer “I didn’t authorize this” disputes. However, Apple Pay doesn’t prevent friendly fraud, fulfillment-related disputes, or “item not as described” claims. You still need prevention systems for those categories.
How long does it take to see financial results from chargeback reduction?
Most eCommerce businesses see measurable dispute ratio improvement within 60 to 90 days of implementing prevention changes (billing descriptor updates, communication workflows, fraud filters). Negotiating improved settlement terms based on that lower ratio typically takes an additional 30 to 60 days. Plan for a 3 to 6 month timeline from first action to quantifiable cash flow improvement.
Can I negotiate settlement speed with my current processor?
Yes, and most merchants don’t realize this. If your dispute ratio has improved, your transaction volume is stable or growing, and your average ticket size is consistent, you have leverage to request faster funding. Prepare your dispute ratio trend data and total monthly volume before the conversation. If your current processor can’t or won’t offer competitive terms, use that data when evaluating alternatives.
What’s the difference between chargeback alerts and chargeback prevention?
Chargeback alerts (like Ethoca or Verifi CDRN) notify you when a customer initiates a dispute, giving you a window to issue a refund before it formally posts as a chargeback. This protects your dispute ratio but costs you the transaction revenue. Prevention stops the dispute from being initiated at all, through better communication, accurate billing descriptors, and fraud filtering. Both are valuable, but prevention preserves both your ratio and your revenue.